We built everything on this page and all of it works. Open it, poke around, press the buttons. The data is fictional or public, so there is nothing to break.
People who play EuroMillions rarely have the numbers at hand: the odds, the cost of a multiple bet, or what is left of a prize after tax.
The solution.
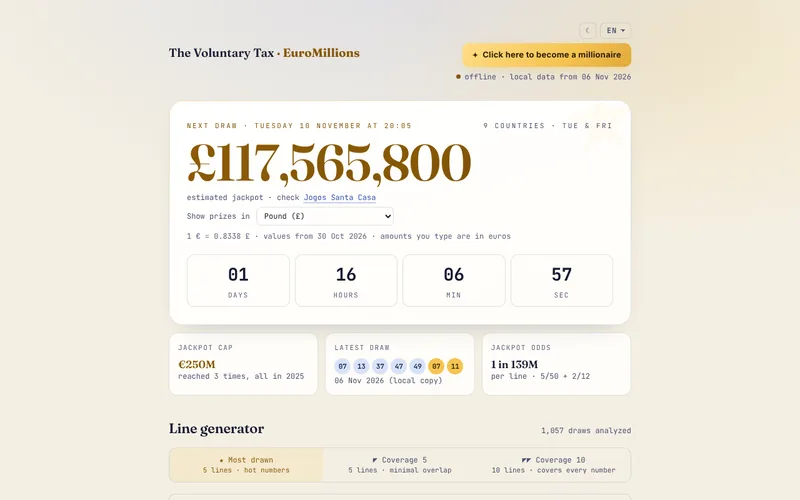
A website in Portuguese and English that reads the results of over a thousand draws, generates lines, works out odds and multiple bets, splits prizes with stamp duty and keeps the game history only in the visitor's browser. A statistical test shows that past frequencies predict nothing.
What the client gets.
Decisions with the numbers in front of you, no mental arithmetic, and no personal data on any server.
Tools.
HTML, CSS and JavaScript, Python for the statistical analysis, GitHub Actions to update the results.
Personal project with public data. Not affiliated with Jogos Santa Casa.
The wind maps shared on social media are videos: you cannot move the map, pick an hour or tap a plane, and weather and air traffic live in different apps.
The solution.
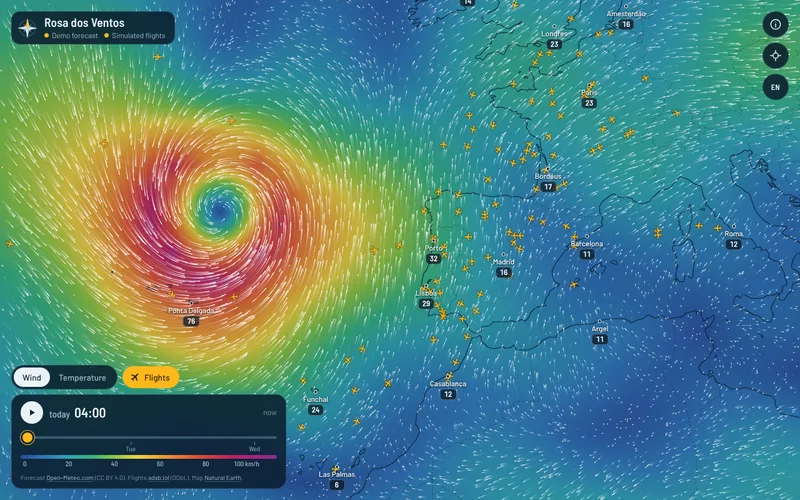
A website that draws the wind as moving particles over a color map, with an hourly forecast for the next 48 hours and the planes on top. A tap on the map shows the wind and temperature at that point, and a tap on a plane shows its altitude, speed, heading, aircraft type and the path it has flown.
What the client gets.
A storm and the traffic around it, read at a glance on one screen, with no sign-up and no ads. When a data source fails, the map keeps working on demonstration data and says so clearly.
Tools.
HTML, CSS and JavaScript, Leaflet and canvas for the map, forecasts from Open-Meteo, ADS-B positions from the adsb.lol network and a small proxy on Cloudflare Workers.
Personal project with public data. On this site's page, the forecast and the flights are simulated, and the map says so.
Passengers who arrive hours late do not know whether they are owed compensation or how much. The rules of Regulation (EC) No 261/2004 depend on the distance, the airline and how much notice was given.
The solution.
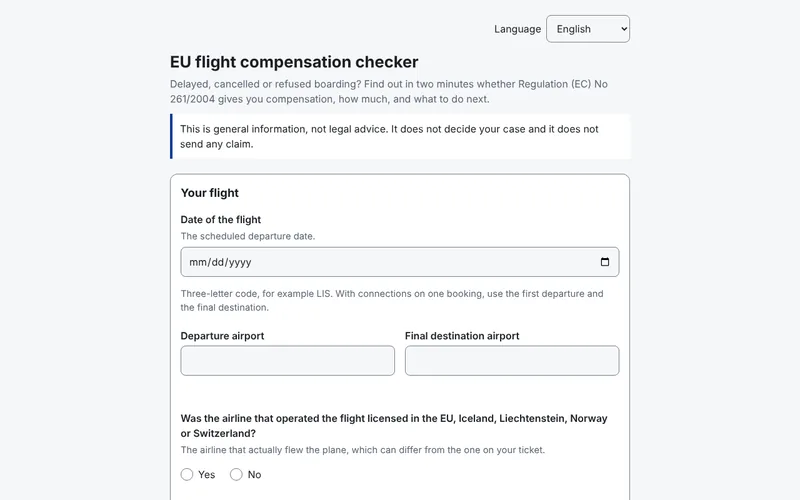
The site asks for the flight date, the departure airport and the final destination, whether the airline that operated the flight is licensed in the EU, Iceland, Liechtenstein, Norway or Switzerland, and what happened. For a delay it asks how late you reached your final destination; for a cancellation, how many days of notice you got and when the alternative flight left and arrived; for denied boarding, whether you got another flight and how late it arrived. It then works out the distance and shows whether the flight is covered, the amount of 250, 400 or 600 euros and whether the airline may cut it by 50%. Extraordinary circumstances are explained but not decided. Every line of the result shows the article or ruling it comes from, and the footer shows the date the rules were checked. It is in six languages and works offline after the first visit.
What the client gets.
Knowing in a few minutes whether a claim is worth making, with the rules in plain view and the next steps. Nothing you type leaves your device. It is general information, not legal advice: the site does not write the claim or decide whether there were extraordinary circumstances.
Tools.
HTML, CSS and JavaScript with no libraries, the rules of Regulation (EC) No 261/2004 and rulings of the EU Court of Justice checked on 13 November 2026, airport coordinates from OurAirports.
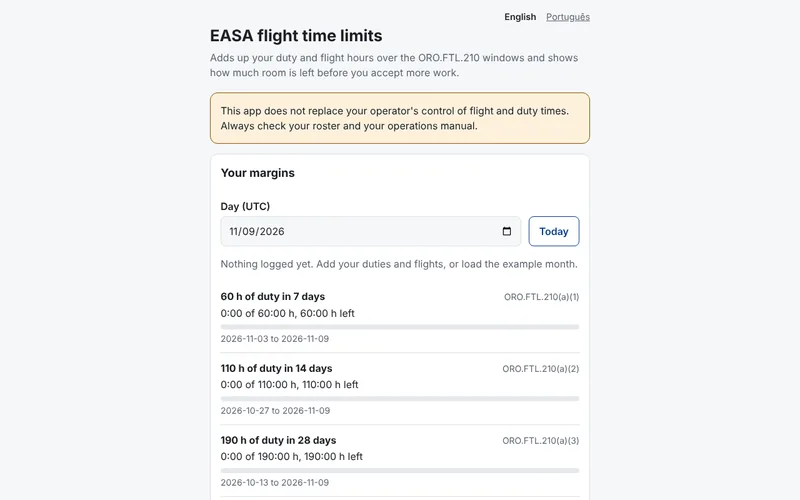
Before accepting an extra flight, a crew member needs to know whether they stay within the cumulative flight and duty limits. Today they do the sums by hand or in a spreadsheet.
The solution.
Each duty and each flight is logged with its start and end time in UTC. The website and the app total them over 7, 14 and 28 days, the calendar year and 12 months, show how much room is left under each limit and warn when a planned duty would go over, with the hours and dates involved. Records export and import as CSV, stay on the device only, and everything works offline. The website installs on a phone and the app runs on Android and iOS, both on the same calculations.
What the client gets.
A quick answer before saying yes to a flight, without spreadsheets. It does not replace the operator's own monitoring, and it says so on screen.
Tools.
HTML, CSS and JavaScript with no libraries, app in React Native with Expo, ORO.FTL.210 limits checked on EUR-Lex and in the EASA Easy Access Rules on 9 November 2026.
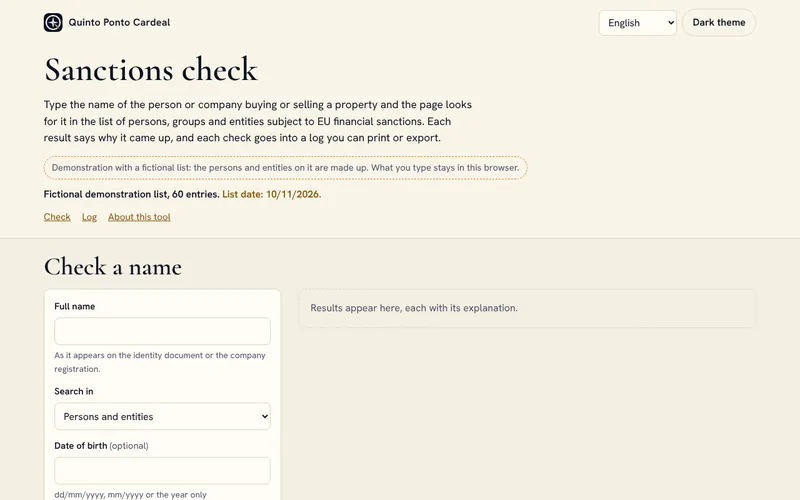
Estate agencies in Portugal must make sure their clients are not subject to EU or UN sanctions. Many small agencies run this check by hand, one name at a time, and a missing accent or a surname in the wrong order is enough for a match to slip through.
The solution.
A page where you type the name and, if you wish, the date of birth and nationality. The matching copes with accents, swapped order, missing middle names, hyphens, initials, the most common transliterations and names written in Cyrillic. Each result says whether the match is likely, possible or unlikely, with the score, the words that matched and why, the entry reference and the date of the list. The log of checks stays in the browser, can be printed or saved as a PDF with the agency name and date, and exports as CSV. The demo uses a fictional list of 60 entries in the same structure as the official EU files. The owner of the page can download the official list to their own computer with a script and update it every day.
What the client gets.
A check that finds the name even when it is written another way, with an explanation to show anyone who asks and a dated record of every search. What you type never leaves the computer, and the page says that a match, or the lack of one, does not replace the agency's own decision.
Tools.
HTML, CSS and JavaScript with no libraries, name matching with Jaro-Winkler and edit distance, reading of the EU financial sanctions XML and CSV files, more than 80 tests with fictional names.
Demo project with a fictional list. Not legal advice.
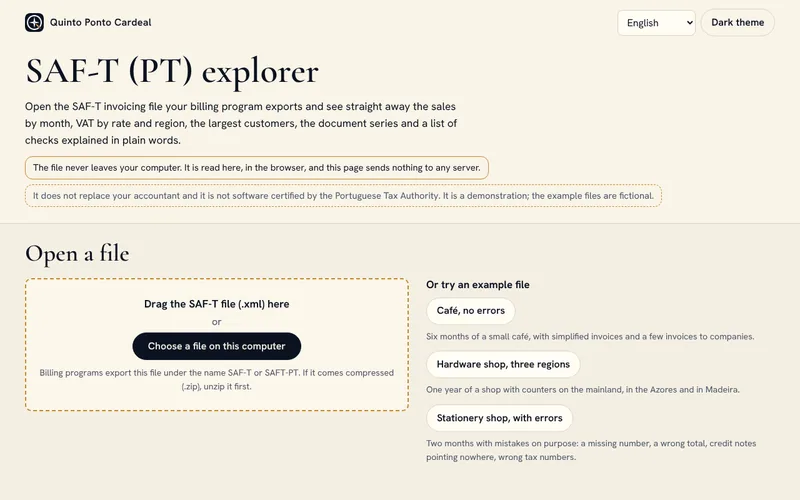
Every month, invoicing software exports the SAF-T (PT) file, a large XML file made for machines. Hardly anyone opens it, and a valid tax number that belongs to another customer, a rounding difference or a document left out of the period is only found once the problem has gone further.
The solution.
A page that reads the file in the browser itself and shows sales by month, VAT by rate and by region (mainland, Azores and Madeira), the top customers and the document series and types, with the numbers used and cancelled. Nine checks, explained in plain language, point to the documents involved: unbroken numbering, dates in order, totals of each document and of the header, cancelled documents, credit and debit notes linked to invoices, tax numbers by check digit, signature present and file format. Tables and checks export to Excel. There are three sample files, one with deliberate errors.
What the client gets.
See in a few minutes what was sold and what should be fixed in the invoicing software, without handing the file to anyone, and send the accountant a tidy Excel file instead of an XML. It does not replace the accountant or the official validator.
Tools.
HTML, CSS and JavaScript with no libraries, XML read in chunks in a Web Worker, Excel written by the page itself, SAF-T (PT) structure from Portaria no. 302/2016.
Demo project with fictional files. Not software certified by the Portuguese Tax Authority.
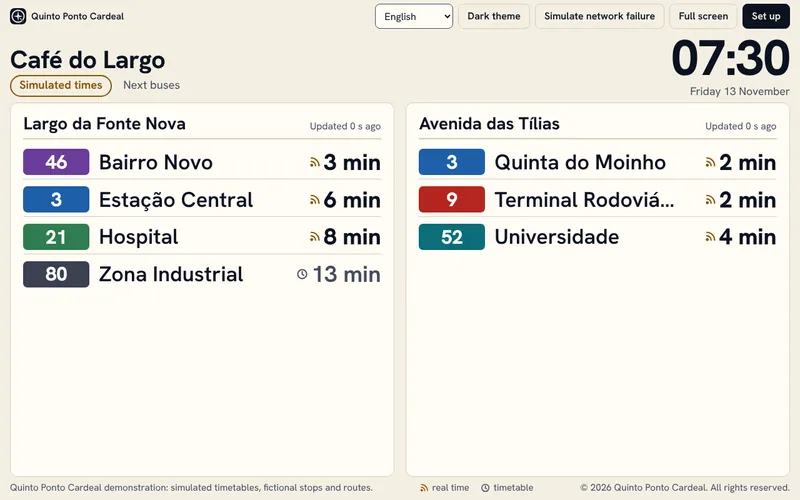
To find out how long until the bus comes, you have to open an app on your phone. In a café, a school or the entrance of a building, that information is not in view for anyone.
The solution.
A page that turns a cheap tablet or a TV browser into a board that can be read from 3 or 5 metres. Each row shows the route number in its colour, the destination, the minutes left and whether the time comes from a bus on the road or from the timetable. On a setup screen the owner picks up to 4 stops, up to 8 routes per stop, the title, the language and the theme, and the choices fit in a link to open on the TV. If the network fails, the board carries on with the last data, says how long ago it arrived and retries on its own. Besides the demo, there is a live data mode using the Carris Metropolitana open API, which is turned on in the setup; it does not work on this page, because the page makes no requests to other addresses.
What the client gets.
People waiting see how long is left without taking their phone out. No subscription or server is needed: it is a static page that runs on a device that is often already there.
Tools.
HTML, CSS and JavaScript with no libraries, tests in node:test, Carris Metropolitana open API in live data mode.
Demo project. The stops, routes and times are fictional.
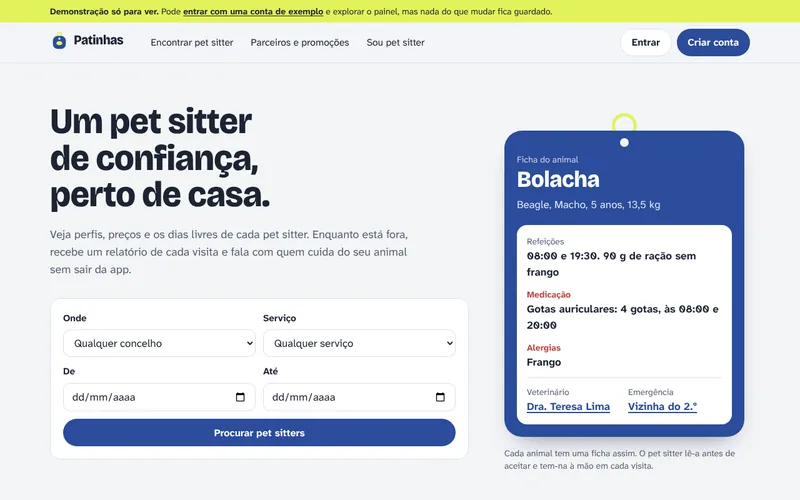
People who look after other people's animals keep each animal's instructions, their bookings and their chats with owners scattered across messages and notes, and anyone looking for a pet sitter has to check prices and free days one by one.
The solution.
A website that installs on a phone as an app. The animal's profile holds food, medication with doses and times, allergies, the vet, routine and an emergency contact, and the house instructions are only shown to the pet sitter once they confirm the booking. The pet sitter chooses their municipalities, the animals they accept, their days and how many bookings they take per day, and search and requests respect that availability. The owner requests a booking, can ask for a meeting first and talks to the pet sitter through in-app messages. At each visit the pet sitter records whether the animal ate, drank, took its medication and went for a walk, and at the end the owner can leave a review. Clients from outside the app go into the same calendar, and shops, clinics, hotels, kennels and catteries have a partner page with offers.
What the client gets.
For the pet sitter, bookings, profiles and visits in one calendar, including the clients they already had. For the owner, a report on every visit. Payments are not part of this version yet.
Tools.
Next.js 16, TypeScript, Tailwind CSS 4, Drizzle ORM with PostgreSQL, installable app (PWA), unit tests and an end-to-end test in Chrome.
Working name. In development, with demo data. The demo is view-only: explore as much as you like, but nothing you do is saved.
METAR and TAF explained: the weather at Portuguese aerodromes
The problem.
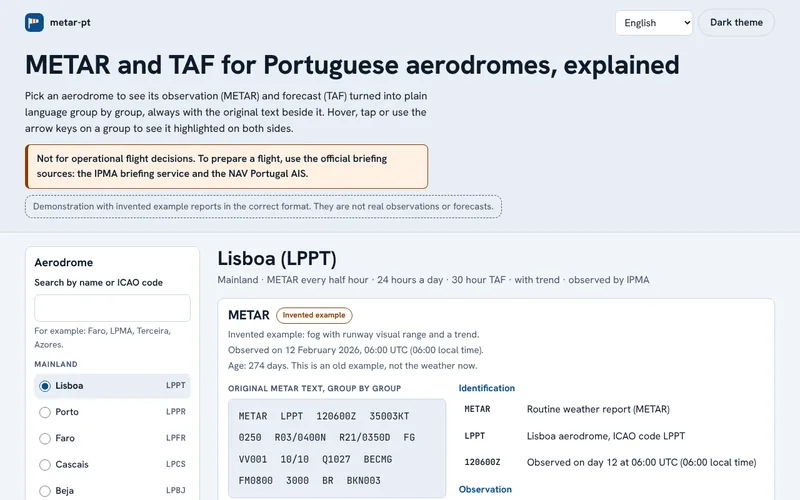
METAR reports and TAF forecasts are written in code, with abbreviations and numbers run together. Student pilots and aviation enthusiasts spend time decoding each group.
The solution.
A page that shows the METAR and, where there is one, the TAF of each aerodrome on the mainland, in Madeira and in the Azores, split into groups. Tapping a group highlights its plain-language explanation alongside: wind, visibility, present weather, clouds, temperature, QNH, trends and change groups. Knots are also shown in km/h and feet in metres. A group the decoder does not recognise is kept as written and flagged. A box explains any pasted METAR, SPECI or TAF, without sending anything elsewhere.
What the client gets.
Understand a report in seconds and learn the code with the original always in view. It is not for flight decisions: to prepare a flight, use the official sources from IPMA and NAV Portugal.
Tools.
HTML, CSS and JavaScript with no libraries, WMO format (No. 306 and No. 782) and ICAO Annex 3, list of aerodromes from AIP Portugal, tests in Node.js.
The reports are made-up examples in the correct format, with past dates. This version has no live data.
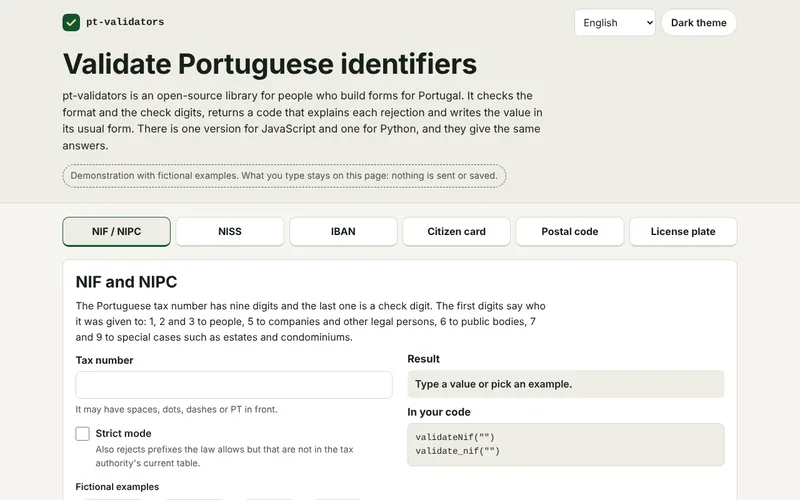
Anyone building forms for Portugal has to check tax, social security and bank account numbers and postcodes. The rules are spread over several sources and every program ends up with its own version, not always right.
The solution.
Two packages, one for JavaScript and TypeScript and one for Python, with no dependencies and tested against the same 167 shared cases, so they give the same answer for the same value. Each check returns a code that explains the refusal, and the value written in its usual form. The NISS and the Citizen Card number are marked as experimental, because the check digit rule has not been confirmed by an official source.
What the client gets.
Fewer mistyped numbers getting into forms, with the same rule in the browser and on the server. A valid number is a well-formed number: it does not prove that the person, company or account exists.
Tools.
TypeScript and Python with no dependencies, 167 shared test cases, demo page in HTML, CSS and JavaScript.
The packages are not yet published on npm or PyPI.
Cheap electricity hours: when to run the machine to pay less
The problem.
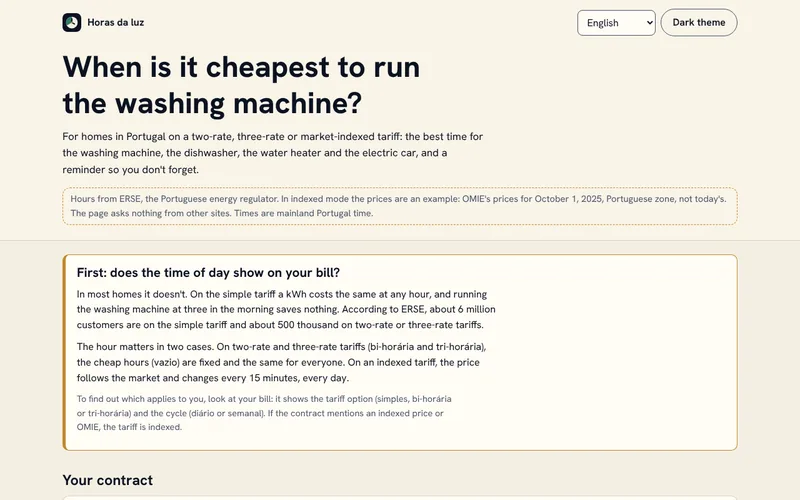
Electricity tariffs confuse a lot of people. On the simple tariff the time makes no difference, but on two-rate and three-rate tariffs the cheap hours depend on the cycle, and on an indexed tariff the price changes every 15 minutes. In 2027 the fixed hours will change, meter by meter.
The solution.
A page that starts by asking whether the time matters and says plainly that on the simple tariff it does not. On a two-rate or three-rate tariff it shows the current period and the cheap hours for today, tomorrow and the week, with the hours in force or the new ones ERSE approved for 2027. On an indexed tariff it uses OMIE's day-ahead market prices for Portugal and finds, for each appliance, the cheapest unbroken run. On a two-rate or three-rate tariff it gives the next two good start times for each appliance; in both cases it shows the estimated cost. It reminds you with a notification while the page is open, or with a calendar file that works with the page closed.
What the client gets.
Knowing whether it is worth changing the time and what each run costs, without doing the maths. The figures are estimates and do not replace the bill or ERSE's simulator.
Tools.
HTML, CSS and JavaScript with no libraries, opens offline after the first visit, ERSE time periods and regulated prices, OMIE prices, iCalendar format.
In the demo, the indexed tariff uses an example day: OMIE's real prices for 1 October 2025, so there are no future times to be reminded of in that mode. It covers mainland Portugal only.
Sample figures laid out so you get them in a minute.
21 projects
Power BI
Dashboard for a real estate agency
The problem.
An agency's management can't see in one place what is for sale, what has already sold and where leads come from.
The solution.
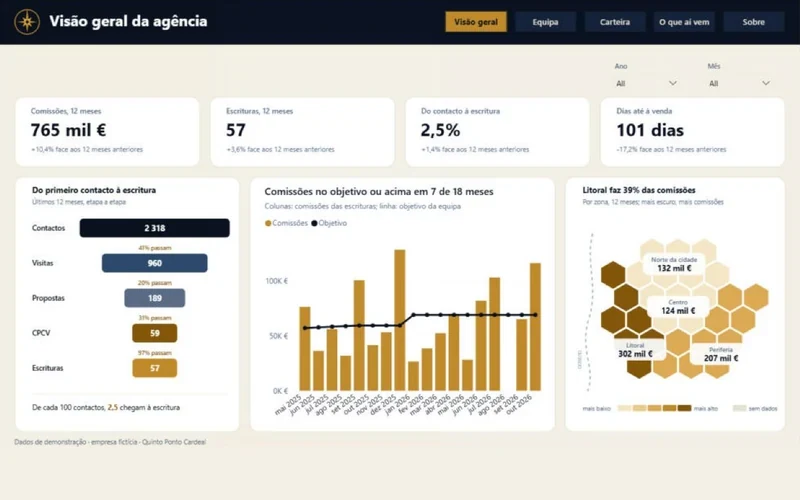
An eight-page Power BI dashboard, built for a fictional agency, with a cover page and a menu on every page. It shows the sales funnel, each consultant's work, the property portfolio, what visitors say, asking prices against the market and expected commissions.
What the client gets.
A Monday meeting that starts with the numbers instead of the search for them, and the chance to spot early what has stalled.
Tools.
Power BI, DAX, Python.
Demonstration project with fictional data.
Fictional data
Power BI and Excel
Financial dashboard for small businesses
Sales, margin, budget against actual and a three-month cash forecast, on a single screen.
Fictional data
In preparation
Public data
Property market by municipality
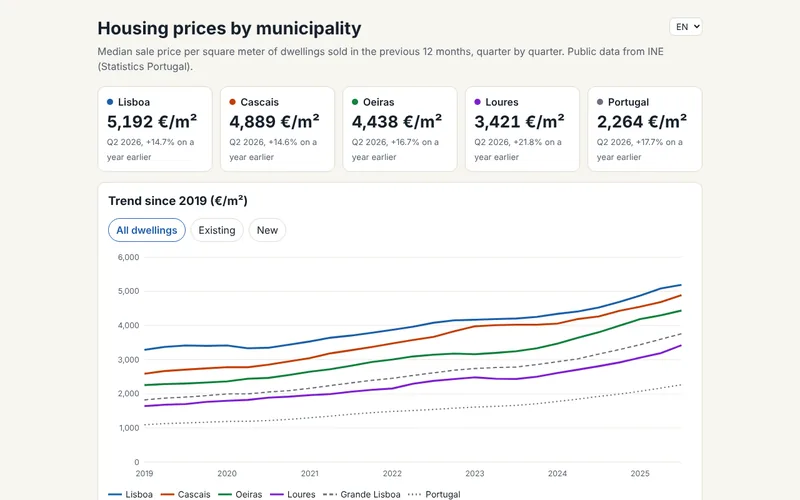
Price per square metre in Loures, Lisbon, Cascais and Oeiras, from public statistics published by INE.
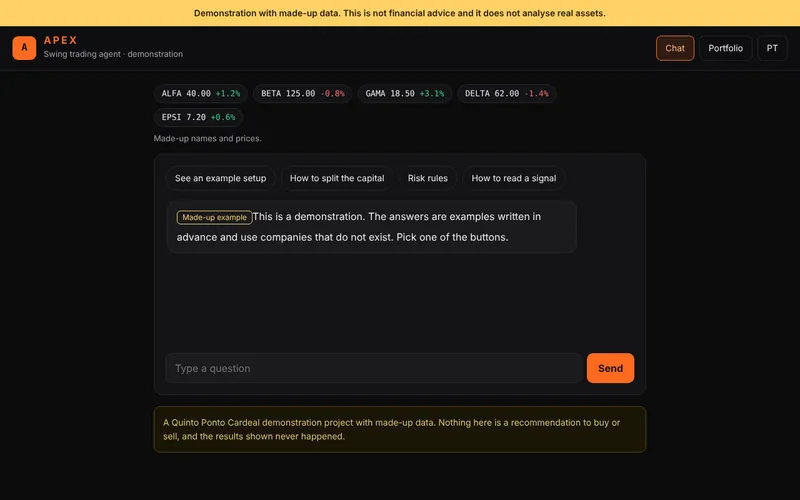
Shows how an agent lays out a trade that lasts a few days: entry, stop, target, how the capital is split and a log of results. All with invented companies and numbers.
Housing prices in 308 municipalities: a Power BI report
The problem.
People who work in the housing market, for example an agency deciding where to look for new listings, need to compare each municipality with the country and see where prices and sales are heading, not just today's price.
The solution.
A Power BI report that reads from INE the median sale value per m² and the number of sales over the last 12 quarters. On the Overview page, a metric selector changes at once the map of the nine regions drawn as hexagons, the national trend and the ranking of the 10 municipalities with the highest value. The Municipalities page lists every municipality with a published value and has a scatter of sales against price that plays quarter by quarter. The Opportunities page sorts municipalities into four market rhythms against the country and lists the 10 below the national median where prices and sales are growing faster than in the country. Each municipality's detail page shows its place in the country and the price of new and existing homes. The titles of the main charts state each chart's conclusion and are written from the numbers. INE does not publish values for municipalities with fewer than 33 sales, and those appear without a price. The idea comes from Are You Moving?, by the NextAgenda team, first place in the Danish Power BI championship in 2021.
What the client gets.
Comparing any municipality with the country in a few clicks, with the credit to INE on every page.
Tools.
Power BI in PBIP format, Power Query connected to the INE public API, DAX with user-defined functions, animated SVG charts generated by DAX, Python to generate the project.
Public data from INE, under a CC BY 4.0 licence, transformed by Quinto Ponto Cardeal.
Public data from INE
In development
Power BI
Restaurant: when the place fills up and which dishes make money
The problem.
A restaurant owner knows Saturday dinner is full, but not how much each service brings in, which dishes leave a margin or how many guests to expect next month.
The solution.
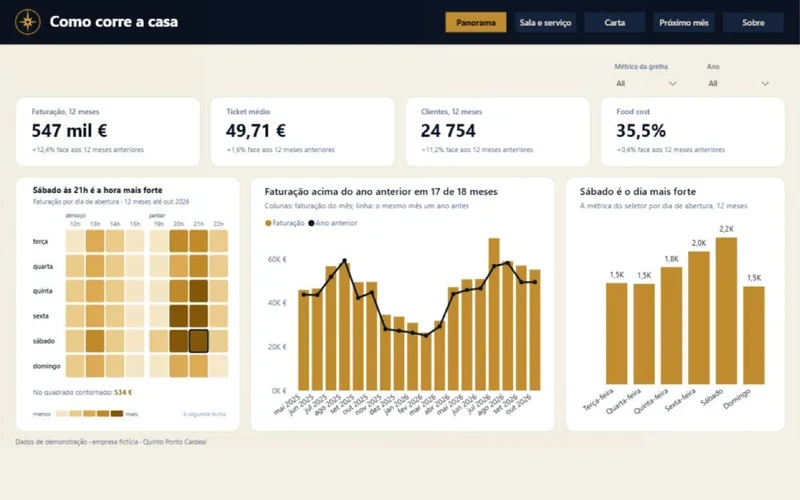
A Power BI report for Casa do Pátio, a fictional restaurant. The Overview page has a grid of weekday by service hour, with the busiest hour outlined. The Dining room and service page compares occupancy at lunch and dinner and the guests in each channel. The Menu page classifies each dish as a star, plowhorse, puzzle or dog, using the Kasavana and Smith method, and opens a detail page for each dish. The Next month page shows a calendar with the guests expected each day and five actions written from the numbers, for example how much raising the plowhorses by 50 cents would bring in. The titles of the main charts state each chart's conclusion and are written from the numbers. The structure follows the SQLBI 3-30-300 rule and the Maven Analytics business challenges.
What the client gets.
Knowing which service needs more staff, which dishes to rework or drop and where to raise prices.
Tools.
Power BI in PBIP format, DAX with user-defined functions, animated SVG charts generated by DAX, Python to generate the demonstration data.
Demo project. The Casa do Pátio restaurant is fictional, as are the menu and the figures.
Fictional data
In development
Power BI
Fashion and home store: where growth comes from and which stock is sitting idle
The problem.
A shop sees it sold more than last year, but does not know whether that came from selling more units, selling more expensive items or raising prices, or which stock is sitting idle in the warehouse.
The solution.
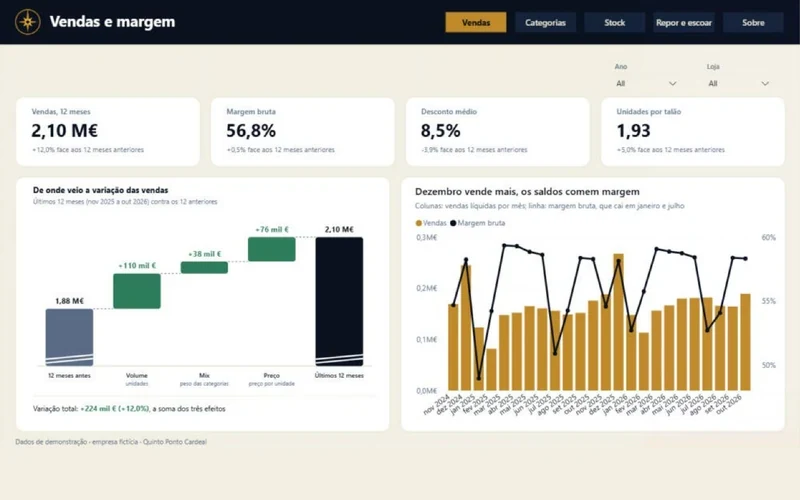
A Power BI report for Tramela, a fictional fashion and home company with shops in Lisbon and Cascais and an online store. The Sales page splits the change in sales into volume, mix and price in a waterfall bridge. The Categories page compares the categories and has a scatter of stock turnover against margin that plays month by month. The Stock page shows the ABC map, one item per column, with sales going up, stock going down and the Pareto curve on top. The Reorder and clear page lists the items with less than 45 days of cover, with the units to order to reach 90 days, and the C items with more than 180 days of stock. Each item's detail page says whether to reorder it, clear it or leave it as it is. The bridge follows the Zebra BI price, volume and mix templates.
What the client gets.
A list of what to order and what to put on promotion, with each shop's cover so stock can be moved between shops before ordering.
Tools.
Power BI in PBIP format, DAX with user-defined functions, animated SVG charts generated by DAX, Python to generate the demonstration data.
Demo project. The company Tramela is fictional, and the figures are demonstration data.
Fictional data
In development
Power BI
Online store: where visits are lost and how many customers come back
The problem.
An online store knows how many orders it took this month, but not at which step it loses visitors, which channel earns most per euro spent or how many customers buy again.
The solution.
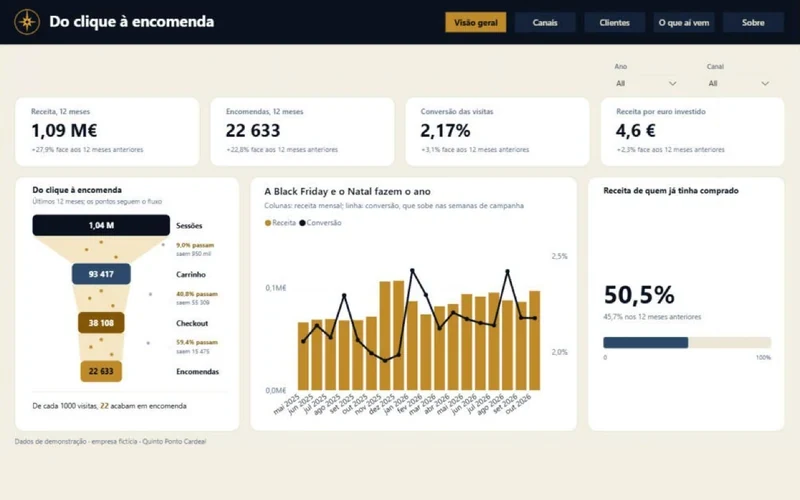
A Power BI report for Verdelume, a fictional online store. The Overview page has the funnel from visit to order, with dots that drop from step to step. The Channels page compares visits, conversion and cost per new customer, with a scatter that plays month by month, and opens a detail page for each channel. The Customers page has the cohort triangle, one row per month of first purchase, and customer value over the following 12 months by acquisition channel. The What's next page shows the revenue forecast for three months with a range, what to do in each channel (scale up, keep, review or watch the cost) and the eight at-risk customers who spent the most. Cost per new customer only counts channels with spending, so organic traffic does not make marketing look cheaper. The theme follows the Maven Analytics Churn Challenge.
What the client gets.
Knowing where to put the marketing budget and which customers to write to first, before they stop buying.
Tools.
Power BI in PBIP format, DAX with user-defined functions, animated SVG charts generated by DAX, calculation group, Python to generate the demonstration data.
Demo project. The Verdelume store is fictional, as are the customers, and the figures are demonstration data.
Fictional data
In development
Power BI
Real estate agency: consultants, listings and deeds still to sign
The problem.
An agency's management wants to know which consultants will meet their target, which properties have been on the market too long and what the year will close at.
The solution.
A Power BI report for Varanda Sul, a fictional agency, and the main piece of the set. The Overview page has the funnel from contact to deed, commissions against target and a map of the city's four zones. The Team page compares the consultants, with a scatter of contacts against conversion that plays month by month and a quota bar for each consultant, and opens a detail page for each one. The Listings page shows the properties and the value on the books, the discount on the asking price and the list of properties for sale for more than 120 days, to review their price. The What's next page adds up the promissory contracts waiting for the deed, the commissions already secured and the year's pace against target. The titles of the main charts state each chart's conclusion and are written from the numbers. The idea comes from Property developer's sales analytics, by Alexey Kolokolov, and the SVG cards follow The world of peaches, by Gus Bavia.
What the client gets.
A team meeting that starts with who is far from target and which properties need a new price, with the minimum the year will close at in view.
Tools.
Power BI in PBIP format, DAX with user-defined functions, animated SVG charts generated by DAX, calculation group, Python to generate the demonstration data.
Demo project. The Varanda Sul agency is fictional, as are the consultants and the properties, and the figures are demonstration data.
Fictional data
Power BI
Clinic: schedule, no-shows and patients to call
The problem.
In a clinic, every no-show is an hour of the schedule left empty, and nobody knows on which days and hours people miss most or which booked patients should get a reminder.
The solution.
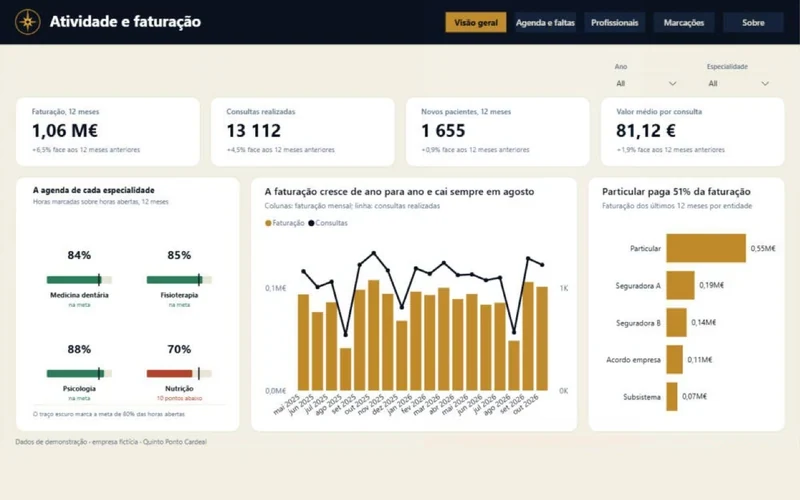
A Power BI report for Vale das Tílias, a fictional clinic with 16 practitioners. The Overview page has an occupancy bar per specialty, with the 80% target. The Schedule and no-shows page has a grid of weekday by hour showing the no-show rate, occupancy or lost revenue. The Practitioners page has a bar per person and a scatter of occupancy against no-shows that plays month by month, and opens a detail page for each practitioner. The Bookings page estimates the no-show risk of each appointment in the next two weeks, from the patient's history, how far ahead it was booked, the day and the hour, and lists the 12 to confirm first, with the reason. Colour is never the only cue: the values are written on every cell and bar. The schedule follows the Maven Analytics healthcare challenges, and the care for accessibility comes from the work of Ruxandra Vilau.
What the client gets.
A call list to confirm appointments before they are lost, and each practitioner's schedule compared with the target.
Tools.
Power BI in PBIP format, DAX with user-defined functions, animated SVG charts generated by DAX, calculation group, Python to generate the demonstration data.
Demo project. The Vale das Tílias clinic is fictional, as are the practitioners and the patients, and the figures are demonstration data.
Fictional data
In development
Power BI
Holiday rentals: what is left after the platform fees
The problem.
People who manage holiday apartments see the nightly rate, but not what is left after each channel's commission and the cleaning, or which nights in the next two months are still unsold.
The solution.
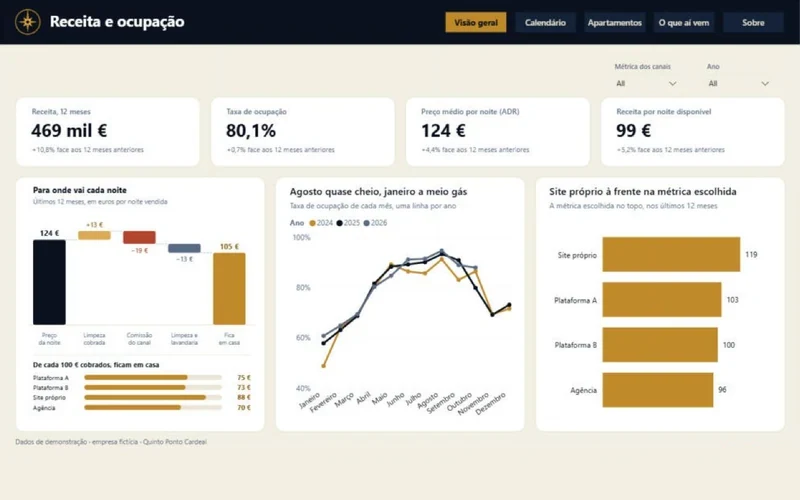
A Power BI report for Postigo Azul, a fictional company. The Overview page has the waterfall of one night, from the average rate to what the owner keeps, and what is left of every 100 euros in each channel. The Calendar page shows the whole year, with one row per apartment and one bar per stay. The Apartments page has a scatter of nightly rate against occupancy that plays month by month, and opens a detail page for each apartment. The What's next page shows the next 60 days, compares bookings with those on the same day a year earlier, marks the gaps of one or two nights between bookings and says what to do in each apartment: lower the price, accept one-night stays, promote the weekends or keep the price. The structure follows the Maven Analytics Vacation Challenge.
What the client gets.
Knowing which channel leaves the most money and which apartments need a price change while there is still time to sell the nights.
Tools.
Power BI in PBIP format, DAX with user-defined functions, animated SVG charts generated by DAX, Python to generate the demonstration data.
Demo project. The company Postigo Azul is fictional, and the figures are demonstration data.
Fictional data
In development
Power BI
Gym: how many members stay and which classes fill up
The problem.
A gym usually notices a member leaving only when they cancel, but weeks before that they had already stopped coming.
The solution.
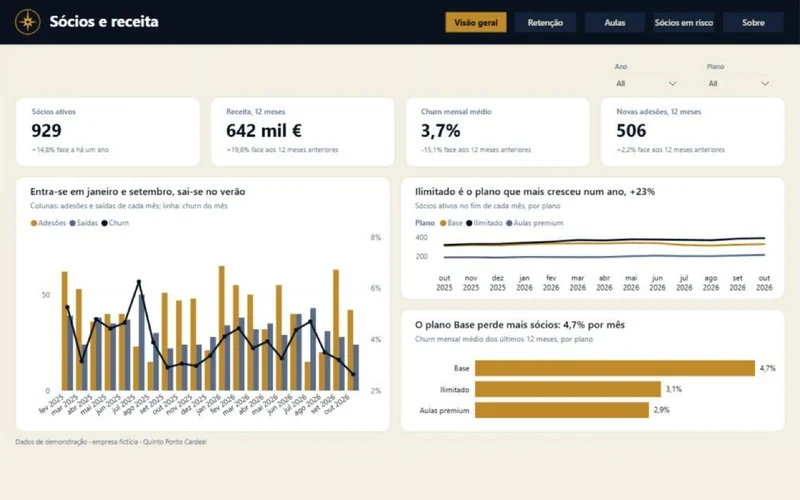
A Power BI report for Estúdio Arcada, a fictional gym. The Overview page shows active members, sign-ups, cancellations and churn for each plan. The Retention page has a triangle with one quarter of joining per row and months of membership in the columns, and compares retention before and after a points club. The Classes page has the weekly map coloured by occupancy and a scatter of occupancy against rating that plays month by month, and opens a detail page for each class that says whether there is demand for another session. The Members at risk page lists the twelve to call first: those who came at least once a week and cut their visits to half or less in the last four weeks. Retention follows the Maven Analytics Churn and Rewards challenges.
What the client gets.
Calling a member while they are still paying, and deciding which classes to add or change based on occupancy and rating.
Tools.
Power BI in PBIP format, DAX with user-defined functions, animated SVG charts generated by DAX, calculation group, Python to generate the demonstration data.
Demo project. Estúdio Arcada is fictional, as are the members and the instructors, and the figures are demonstration data.
Fictional data
In development
Power BI
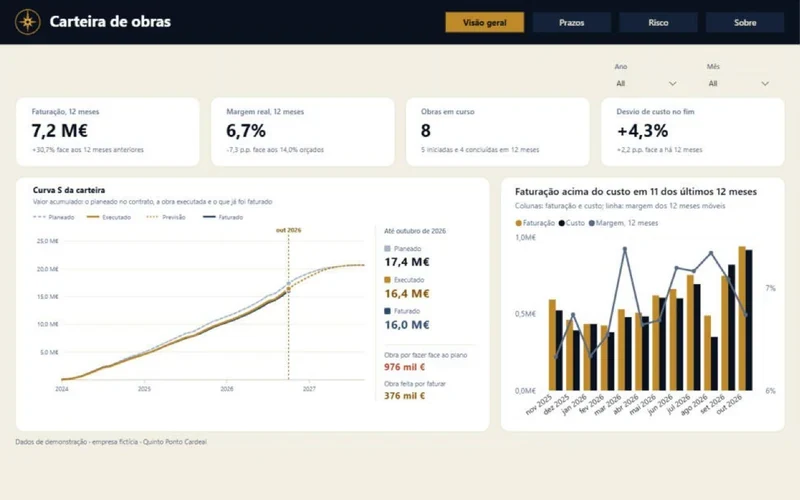
Construction: which projects will run over budget and schedule
The problem.
A contractor often only finds out a project lost money when it ends, and work already done but not yet invoiced goes unwatched.
The solution.
A Power BI report for Traço Firme Construções, a fictional company, with earned value project by project. The Overview page has the portfolio S-curve, with planned, executed, forecast to completion and invoiced. The Schedule page has a Gantt of every project, with the contract period, the work done and the forecast to completion. The Risk page places the ongoing projects in a schedule and cost quadrant that plays month by month and ranks them by margin at risk, with what to do in each: a meeting with the site manager, reviewing purchases, renegotiating the deadline, adding crews or issuing the progress measurement. Each project's detail page shows its own S-curve and its path in the quadrant. The Gantt comes from Construction management, the most liked story in the Fabric community Data Stories Gallery.
What the client gets.
Acting on a project while there is still margin to save, and invoicing work done without waiting for the end.
Tools.
Power BI in PBIP format, DAX with user-defined functions, animated SVG charts generated by DAX, Python to generate the demonstration data.
Demo project. Traço Firme Construções is fictional, as are the projects and the clients, and the figures are demonstration data.
Fictional data
In development
Power BI
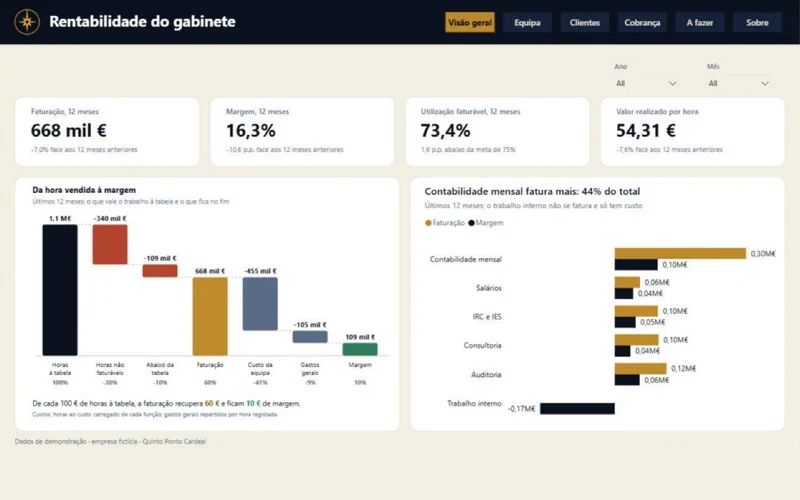
Accounting firm: hours not yet invoiced and clients to chase
The problem.
In a firm, hours that are never invoiced, retainers that were never updated and unpaid invoices eat into the margin without anyone seeing them together.
The solution.
A Power BI report for Linha de Conta, a fictional firm. The Overview page has a waterfall from hours at list price down to margin, step by step. The Team page has a heatmap with one row per person and one column per week, over the last 52. The Clients page has a scatter of hours against value per hour that plays month by month and the 8 clients billed furthest below list price, with a proposal for each retainer. The Collections page shows the age of the debt and the clients with the most overdue. The To do page brings together work done but not invoiced and clients to chase now, with what to do in each case, and filters by the partner in charge. Each client's detail page opens from the Clients page. The idea of taking the reader to an action plan comes from the AstraVale SQL health report, by Marius Helle, world champion in 2026.
What the client gets.
A list for each partner, for Monday morning, of what to invoice, whom to chase and which retainers to review.
Tools.
Power BI in PBIP format, DAX with user-defined functions, animated SVG charts generated by DAX, Python to generate the demonstration data.
Demo project. Linha de Conta is fictional, as are the people and the clients, and the figures are demonstration data.
Fictional data
In development
Power BI
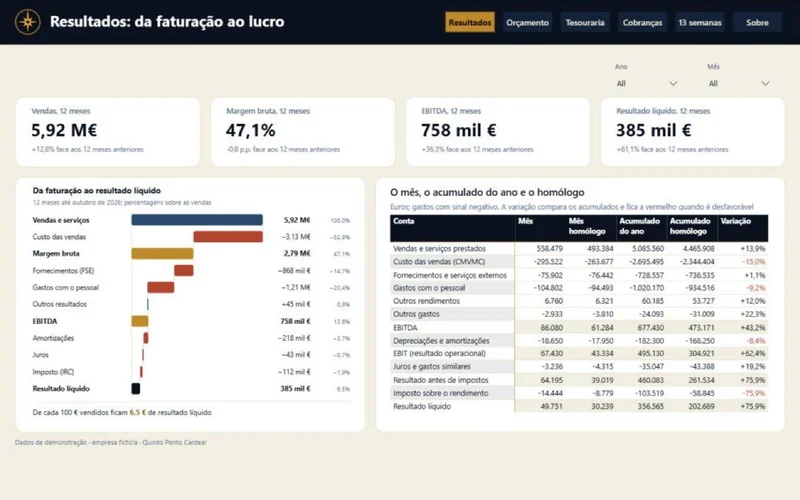
Company finances: results, budget and cash over 13 weeks
The problem.
In a small business, results are only known when the books close, and a cash shortfall two months from now does not show in today's balance.
The solution.
A Power BI report for Metalomecânica Ponte Velha, a fictional company. The Results page has a waterfall from sales to net income, line by line. The Budget page shows the income statement by nature, in the style of the Portuguese accounting standard (SNC), with actuals, budget and variances, and a waterfall from budgeted to actual result. The Treasury page has the month's bridge, from opening to closing balance, and two bars on the same scale with the days customers take to pay and the days the company takes to pay. The Collections page shows the ageing of balances and a scatter of customers that plays month by month, and opens a detail page for each customer. The 13 weeks page forecasts the balance week by week against a chosen safety minimum, and says whether collecting the largest debtor's overdue amount is enough to stay above it. The income statement follows the Zebra BI financial templates and the IBCS rules.
What the client gets.
Seeing weeks ahead when cash will run short and whom to chase first to prevent it.
Tools.
Power BI in PBIP format, DAX with user-defined functions, animated SVG charts generated by DAX, calculation group, Python to generate the demonstration data.
Demo project. Metalomecânica Ponte Velha is fictional, as are the customers and the suppliers, and the figures are demonstration data.
Fictional data
In development
Machine learning
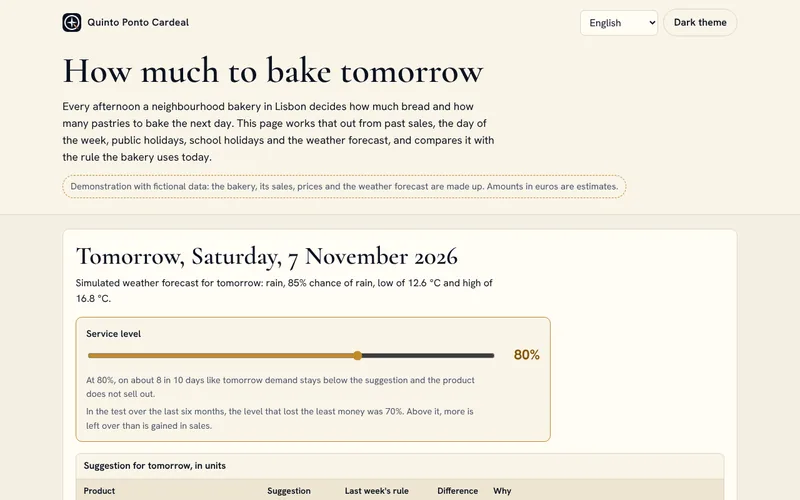
How much to bake tomorrow: a forecast for bakeries
The problem.
Bakeries, pastry shops and cafés throw food away almost every day, or run out at the busiest hour, because the next day's production is decided by gut feeling or copied from the week before.
The solution.
A machine learning model suggests, product by product, how much to bake tomorrow: bread, papo-seco rolls, broa, croissants, pastéis de nata, bolas de Berlim, pão de deus and bolos de arroz. The page shows the suggestion with a short reason, such as “Saturday, rain forecast”, a control to choose the share of days on which a product should not sell out, a chart of the last eight weeks and a test over the last six months, in units and in euros, against the rule of making the same as last week. Weather is part of the sums because it moves sales: when it rains, fewer people walk past and bread is left over. In this demonstration the weather is simulated, and the model can read the real IPMA forecast for Lisbon on request.
What the client gets.
A daily suggestion the owner understands and can adjust. On the demo's fictional data, the test gives less waste and fewer lost sales than the last-week rule. With real data, at least a year of sales would be needed.
Tools.
Python with scikit-learn (gradient boosting by quantile), page in HTML, CSS and JavaScript with no libraries and an SVG chart, IPMA open API as an option.
Demo project with fictional data. The euro figures are estimates based on invented costs and prices.
People who make videos want to know what is working right now, but looking at the most popular videos one by one says nothing about what they have in common.
The solution.
A dashboard that will read the most popular music, film and gaming videos in five countries every day through the official YouTube API, keep 90 days of history and show what the videos at the top share. It will update itself once a day and work on a phone.
What the client gets.
Ideas for original videos drawn from data, without copying or reposting anyone else's videos.
Tools.
Python, YouTube Data API v3, automatic daily collection with GitHub Actions, static dashboard.
Official YouTube API
In development
Web app
Market Pulse: live prices for stocks, ETFs and crypto
The problem.
Stock and crypto prices come from different providers, and free data plans allow a single connection, and the Finnhub key must not be exposed in the browser.
The solution.
A small service opens one connection to Coinbase and another to Finnhub, keeps the latest price of each asset and sends every open browser only the prices that changed, grouped every 250 milliseconds. Anyone arriving sees the whole board at once. The app shows the heatmap by the day's change, with a filter for stocks, ETFs or crypto, a page per asset with 15-minute, 1-hour and 1-day candles, a watchlist kept in the browser with no account, and a search. An indicator shows the connection status and whether the New York stock exchange is open or closed.
What the client gets.
See the market at a glance on a computer or a phone, without mistaking a quiet board for a broken one. The app installs on a phone, and prices are never served from a stored copy.
Tools.
Next.js 16, React 19, Tailwind CSS 4, Lightweight Charts 5, Node 22 service with WebSocket, data from Coinbase, Finnhub and Twelve Data.
Not investment advice.
Live prices
In development
Web app
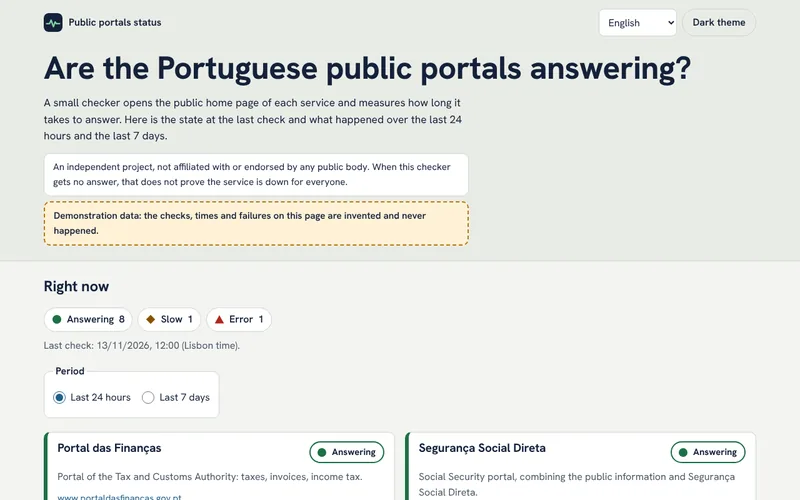
Status of public portals: are the tax and social security sites answering?
The problem.
When the tax portal or the social security site will not open, there is no way to know whether the problem is the service, the home connection or everyone.
The solution.
A small checker opens only the public home page or a public information page of each service, never a logged-in area or a form, and measures how long the answer takes. It follows each site's robots.txt, identifies itself on every request and never runs more than once every 5 minutes. The page shows the current state, the response times, availability as a percentage and a small chart, and each state has its own shape and text as well as its colour.
What the client gets.
Seeing at a glance whether a portal is slow or not answering before wasting time trying. A failure seen by this checker does not prove that the service is down for everyone.
Tools.
Checker in JavaScript, for Node.js or a scheduled Cloudflare Worker, page in HTML, CSS and JavaScript with no libraries.
The history shown was made up for the demo and the checker does not run on a schedule yet. An independent project, not linked to any public body.
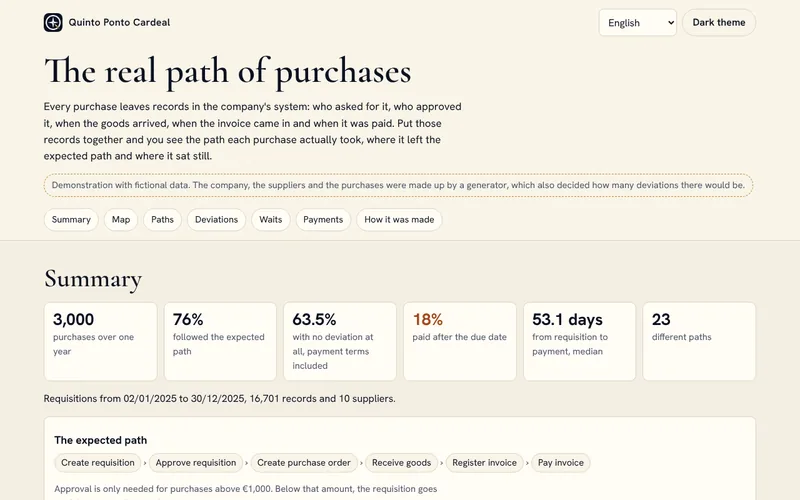
Every purchase should follow the same path, from requisition to payment. In practice there are invoices before the order, orders changed after approval, invoices recorded twice and late payments. Finance usually knows this happens, but rarely knows how often, with which suppliers and where purchases get stuck.
The solution.
A process mining analysis of the purchasing system's event log: the most frequent paths, the process map with the transitions between steps and the wait between them, six kinds of deviation with an example of each, the stages where purchases wait longest, by supplier and value band, and the share of invoices paid after the due date. The data also comes out as a star schema in CSV, ready for Power BI.
What the client gets.
Knowing how often each deviation happens, with which suppliers and where purchases get stuck, so work can start with what matters most.
Tools.
Python for the generator and the analysis, tests that compare what the analysis finds with the deviations the generator put in, star schema in CSV, page in HTML, CSS and JavaScript.
Demo project with fictional data: the company, suppliers, purchases and amounts were created by a generator.
The numbers of each municipality, with source and date
The problem.
The numbers for each municipality are at INE, but spread across indicators, codes and years. For a local journalist, a parish council or someone deciding where to move, gathering and comparing them takes a lot of work.
The solution.
An automated pipeline that will download INE's indicators from its API every month, load them into DuckDB, test and document them with dbt and build one static page per municipality. New data will arrive as a pull request on GitHub, so a person reviews it before it reaches the pages. For now, the pages show six indicators from the 2021 census.
What the client gets.
Seeing in a minute how a municipality is doing and how it has changed, with the origin of every number in view.
Tools.
Python, DuckDB, dbt with tests on every model, GitHub Actions, INE API, static pages in HTML, CSS and JavaScript.
Public data from INE
In development
03
Apps
Apps for Android and iOS, some still being built.
7 projects
Android and iOS app
Ponteiro: medication and care reminders
The problem.
Anyone caring for a parent, a child or themselves has to keep track of dose times, boxes running out, prescriptions and appointments, often on loose bits of paper. When someone else takes over, information gets lost in the handover.
The solution.
An app with several people on the same phone, each with their own medicines, times suggested from their daily routine and alerts with Taken, Snooze and Skip buttons. It counts the boxes, reads prescriptions from a PDF or a photo, keeps readings, appointments, an emergency card and a health record, and has its own screen for babies. It prepares a handover summary and a PDF history to show the doctor.
What the client gets.
Fewer missed doses, boxes bought in time and a clear handover between carers. The data is encrypted on the phone, with no account and no server. The app does not calculate doses or interpret readings.
Tools.
React Native with Expo, TypeScript, SQLite encrypted with SQLCipher, phone notifications, PDF reading and text recognition on the phone itself.
Data stays on the phone
In development
Android and iOS app
Ofício em Dia: quotes and jobs for plumbers and electricians
The problem.
Self-employed plumbers and electricians lose time on quotes written at night on paper or in Excel, requests scattered across WhatsApp and forgotten appointments. Foreign tools are expensive and do not follow Portuguese rules.
The solution.
The tradesperson describes the job out loud and the app builds the quote lines from the catalog, with quantities, prices and VAT, then makes a PDF with their logo. It has a calendar, job sheets with before and after photos and the client's signature on screen, and a card for each client with the history by address. The account for using the app on more than one device will open at launch, and later the client will be able to accept a quote through a link.
What the client gets.
Quotes delivered the same day, looking professional, and fewer evenings spent on paperwork. The margin on materials shows only on screen, never in the PDF. The app does not issue invoices, and every quote is marked as a proposal.
Tools.
React Native with Expo, TypeScript, Supabase for the account and photos, PDF made on the phone.
Sample prices
In development
Android and iOS app
Senhorio em Dia: rent and deadlines for small landlords
The problem.
People who rent out one or a few homes in Portugal keep it all in their head or in Excel: who has paid, when to issue the electronic receipt, how much the rent can go up and how much notice the tenant must get.
The solution.
Landlords save their leases and mark rent as paid. The app works out the possible new rent from the published coefficient, writes the letter to the tenant, and sends alerts on each rent day and before the IMI property tax, the IRS income tax return and the end of the lease. With an account, opened with a code sent by email, the data has a cloud copy and moves to another device. A yearly rent summary for the tax return will come in a future version.
What the client gets.
No missed deadlines and a rent update made within the law, with the letter already written. Only the tenant's name is stored. The electronic receipt is still issued on the tax authority's portal, and the app reminds landlords every month.
Tools.
React Native with Expo, TypeScript, Supabase, phone notifications.
Official coefficients
In development
iPhone app
Recibos em Dia: social security and income tax for freelancers
The problem.
Freelancers in Portugal do not know how much they will pay to Social Security or how much to save for income tax, and they forget the quarterly return due in January, April, July and October.
The solution.
The user answers three questions and sees the estimated monthly contribution straight away, with the rule for people who also have a salaried job. They log the receipts they have issued, see the year's total and the tax reserve, and get alerts before each deadline. With an account, opened with a code sent by email, the receipts have a cloud copy and move to another phone. The App Store subscription will come at launch.
What the client gets.
Knowing the amount before Social Security says it, and no surprises at tax time. The app always says it gives an estimate and never presents itself as an accountant.
Tools.
React Native with Expo, TypeScript, Supabase, phone notifications.
2026 rules
In development
Android and iOS app
Carta Clara: official letters explained
The problem.
Official letters in Portugal are hard to understand, even for Portuguese people, and much more so for newcomers. Not understanding a letter can mean a missed deadline or a fine.
The solution.
The user photographs the letter or imports a PDF, and the app explains in plain words, in five languages, who sent it, what it asks for, the deadline, the amount and the next steps. Deadlines in working days are calculated with national holidays, with alerts before they run out and a history kept on the phone. Reading real letters already works in internal tests and will only open to other people once there are accounts and a limit on requests. Until then, the app explains three fictional sample letters.
What the client gets.
Understanding the letter without waiting for anyone, and not missing the deadline. The image is never stored, and the explanation does not copy tax numbers, bank details, names or addresses. It is information to help read the letter, not legal advice.
Tools.
React Native with Expo, TypeScript, letter reading in a Supabase function, phone notifications.
Fictional letters
In development
Android and iOS app
A Próxima Manif: well-informed demonstrations
The problem.
Information about a demonstration is scattered across messaging groups and posts that get lost, and it is often out of date. Residents, shop owners, the police and the council find out late, and a last-minute change does not reach everyone.
The solution.
Each demonstration has a page with the times, meeting point, route on a map, type of action and a history of changes, which can be saved and read without a connection. Before publishing, the organizer sees the alerts based on Portuguese Decree-Law 406/74 and prepares the advance notice to the mayor as a PDF. For now the app works in Portugal with fictional demonstrations, and publishing through a server, change notifications and official notices from the authorities will come in the next phases.
What the client gets.
One source, the same for everyone: organizers follow the law with less effort, neighbors and authorities can prepare in time, and participants know what has changed. The app applies the same rules to any peaceful and lawful cause, keeps no lists of participants and never shows where the police are.
Tools.
React Native with Expo, TypeScript, the phone's own maps, PDF made on the phone. The server will use Supabase.
Fictional data
In development
Android and iOS app
Ementa em Dia: recipes and kitchen reminders
The problem.
Every week someone has to decide what to eat and what to buy. Recipes rarely say how to make the same dish in the air fryer, the microwave or the Thermomix someone has at home. With the oven and the hob on at the same time, it is easy to forget to turn the chicken or switch off the rice.
The solution.
Users say who eats at home, what they do not eat and which appliances they have, with power and model. The app plans lunch and dinner for all seven days and the shopping list of what is missing, leaving out what is already at home, and each recipe adjusts its times, temperatures and steps to the equipment. In cooking mode, every timed step has its own named timer, several can run at once, and they alert you even with the app closed. The 68 recipes range from fish and meat dishes to soups, desserts, smoothies and fruit, 12 of them good for cooking with children, and the At home tab shows what can be made right now. An account to share the list between the phones in a household will come in a later phase.
What the client gets.
Cooking with what you have, with no mental arithmetic and no dishes forgotten on the stove. Each recipe shows its difficulty and total time, and those that use alcohol as an ingredient offer an alcohol-free alternative. For now everything is kept only on the phone, with no account.
Tools.
React Native with Expo, TypeScript, phone notifications.
68 recipes
In development
04
Games
Small games, made to test ideas and to pass the time.
3 projects
Mobile browser game
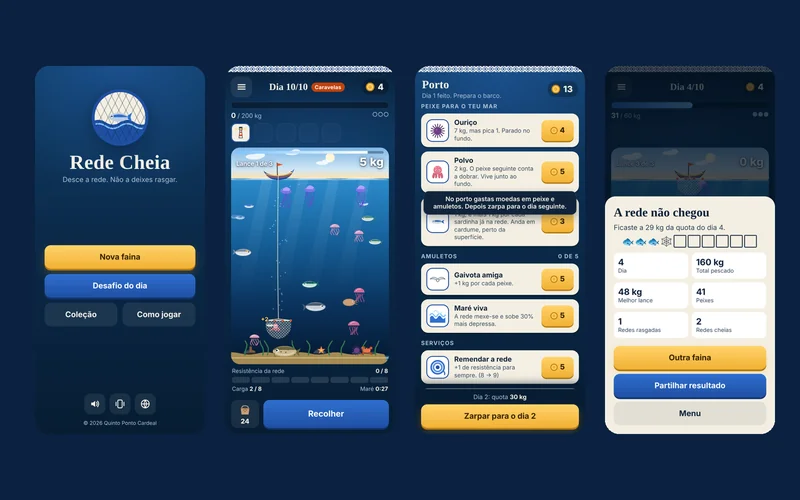
Rede Cheia: a fishing game on the Portuguese coast
The problem.
Short-run games with upgrades between runs are among the best sellers, but almost none can be played with one finger, and none is set on our coast.
The solution.
In each cast the net drops from the boat and the player guides it to the fish at each depth, with thirty seconds of tide. In the harbor, between days, coins buy new fish, bigger nets and charms such as the Barcelos Rooster or Saint Anthony, over ten days with rising quotas. Today it plays in the phone's browser, in Portuguese and English, and installable Android and iOS versions will come later.
What the client gets.
Games of about ten minutes, for a short break, with a new daily challenge that is the same for everyone. No account and no internet connection needed.
Tools.
HTML, CSS and JavaScript with no libraries, canvas and SVG drawing, synthesized sound, Node simulations to tune the difficulty.
A game for a short break has to make sense in seconds and make people want to come back the next day.
The solution.
Dragging a finger anywhere on the screen moves the ship, and the weapons fire on their own. Crystals from the enemies raise the level, and each level brings a choice of three powers; there are eight weapons and twelve powers, and a weapon at its top level, with the right power, turns into another one when a chest is opened. The Warden arrives at five minutes and the Eclipse at nine and a half. Between runs, gold buys permanent upgrades and achievements unlock ships and weapons. It plays in the phone's browser, in Portuguese and English.
What the client gets.
Runs of about ten minutes, for a short break, with a daily challenge that is the same for everyone. No account needed, and once it has loaded it plays without internet.
Tools.
HTML, CSS and JavaScript with no libraries, canvas drawing with glows and particles, sound synthesized in the browser, simulated players in Node to tune the difficulty.
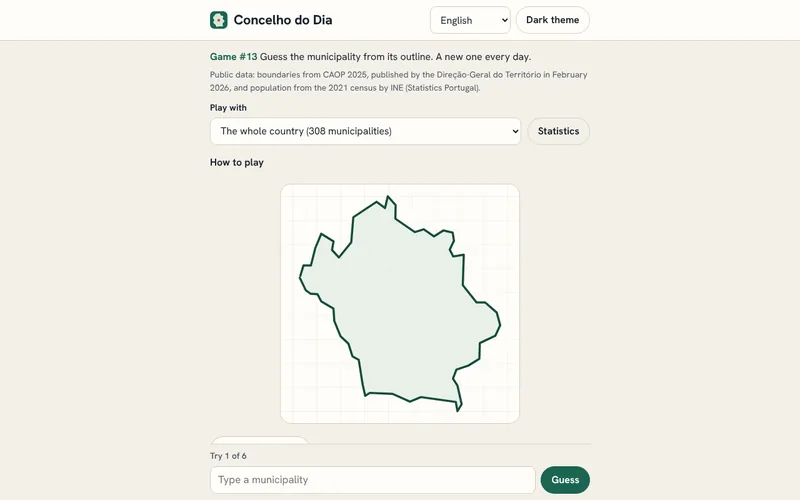
Municipality of the day: guess it from its outline
The problem.
Portugal has 308 municipalities and many are known only by name. A short game, once a day, is a light way to get to know them.
The solution.
A daily game with six tries to name the municipality, on the mainland, in the Azores or in Madeira. Each wrong try shows the distance, one of eight directions and a proximity percentage, and three hints can be opened one at a time: the district or autonomous region, the population band from the 2021 census and the first letter of the name. Everyone plays the same municipality on the same day, and none comes back until all 308 have been played. There is an easy mode by district or region, statistics kept only in the browser and a result in squares and arrows to share.
What the client gets.
A minute a day learning the country's geography, with no account, no cookies and no requests to other sites.
Tools.
HTML, CSS and JavaScript with no libraries, municipal boundaries from CAOP 2025 (Direção-Geral do Território) and population from INE's 2021 census, both under CC BY 4.0.
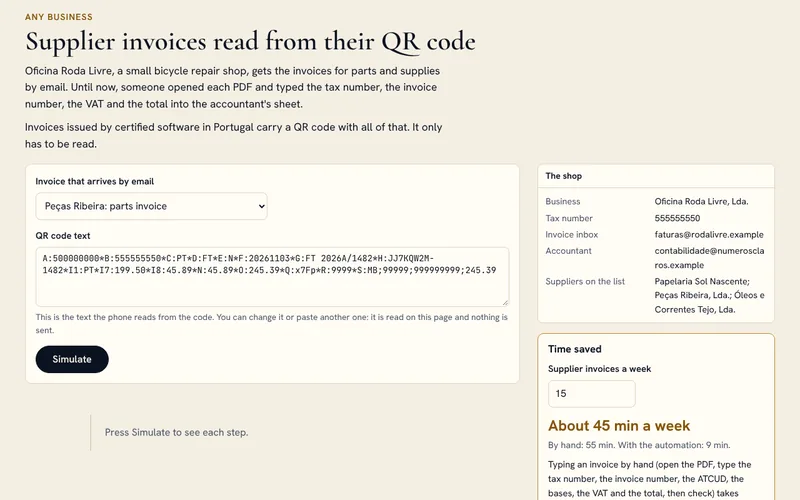
At Oficina Roda Livre, invoices for parts and supplies arrive by e-mail as PDFs. Someone opened each one and typed the tax number, the invoice number, the VAT and the total into the accountant's sheet by hand.
The solution.
A Power Automate flow saves each PDF in a SharePoint folder by year and month, adds a To read row to Excel and posts a notice in Teams. In a Power Apps app, someone points the phone camera at the QR code, on the screen or on paper. The app splits the fields, checks the tax number's check digit, the workshop's tax number, the ATCUD and the totals, and fills in the row. An invoice with the same ATCUD does not go in twice. On Fridays at 17:00 the accountant gets the week's summary by e-mail.
What the client gets.
Each invoice goes from about 3 minutes by hand to about 30 seconds, without typing a number, and the weekly summary goes from 10 minutes to 1. These are estimates, with the assumptions shown on the page.
Tools.
Outlook, Power Automate, SharePoint or OneDrive, Excel, Power Apps and Teams, with Microsoft 365 Business Basic, Standard or Premium. With standard connectors, Power Automate cannot read the QR code inside the PDF, so it is read with the camera.
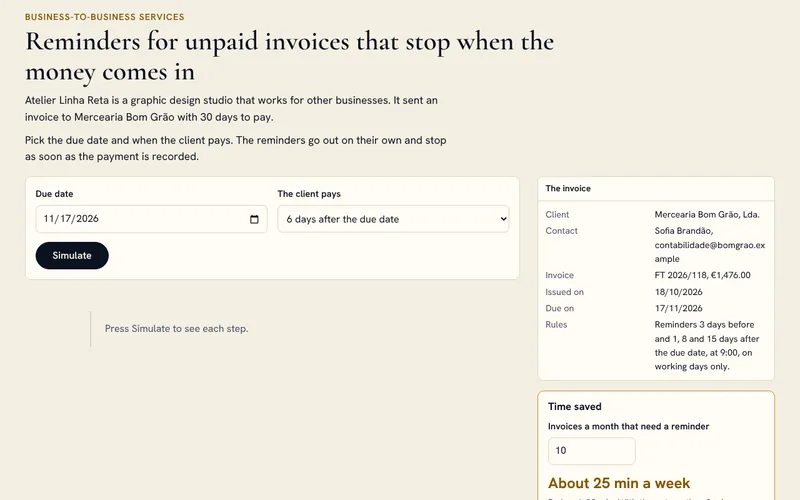
Reminders for unpaid invoices that stop when the money comes in
The problem.
Atelier Linha Reta does graphic design for other businesses and gives 30 days to pay. Reminding clients who had not paid meant writing every e-mail by hand, whenever someone remembered to check the sheet.
The solution.
An Excel table with the invoices issued and a flow scheduled every working day at 9:00, which reads only the rows with no payment date. It picks the right template: a reminder 3 days before the due date and notices 1, 8 and 15 days after, the last one mentioning the Portuguese late payment law (Decree-Law No. 62/2013). Nothing goes out at weekends, and each send is written on the row so it is not repeated. When someone fills in the payment date, the reminders stop and, if notices had already gone out, a thank-you follows. After the final notice the flow stops sending e-mails and asks the owner in Teams to call the client.
What the client gets.
Each reminder written by hand took about 5 minutes. The e-mails go out and stop on their own, always polite, and phone calls are kept for when they are needed.
Tools.
Excel, Power Automate, Outlook and Teams, with Microsoft 365 Business Basic or higher and a shared mailbox. The flow only knows what is in the sheet: a payment that is not recorded means one reminder too many.
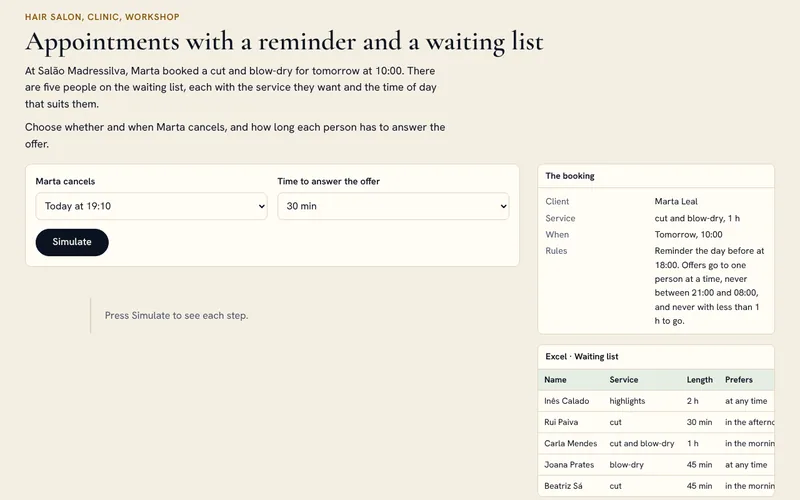
At Salão Madressilva, appointments were confirmed by phone or message, and every cancellation meant a round of calls down the waiting list.
The solution.
Bookings sends the confirmation, with the button to manage the appointment, and the reminder the evening before at 18:00. When someone cancels, a Power Automate flow searches the waiting list, filled in through a Forms form, for someone who wants a service that fits the free slot at the right time of day. The offer goes by e-mail to one person at a time, with Accept and Can't make it buttons and a time to answer. Between 21:00 and 8:00 it waits for the morning, and close to the time it stops making offers. When someone accepts, the salon is told in Teams and books it in Bookings with one tap.
What the client gets.
Confirming each appointment, about a minute and a half each time, is no longer needed, and a cancellation goes from about 10 minutes of calls to about 1 minute to book whoever accepted.
Tools.
Microsoft Bookings, Power Automate, Microsoft Forms, Excel or Microsoft Lists, Outlook and Teams, with Microsoft 365 Business Basic, Standard or Premium. The Bookings connector is still in preview and cannot create bookings, and the reminders are by e-mail only.
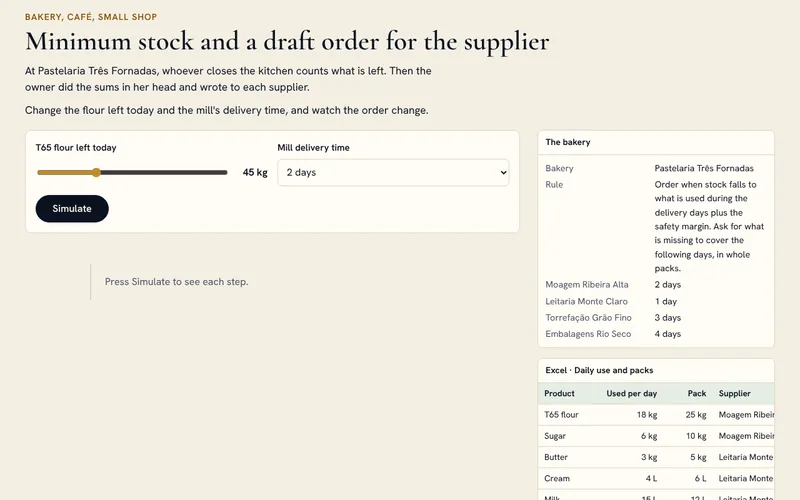
At Pastelaria Três Fornadas, whoever closes the kitchen counts what is left. Then the owner did the sums in her head and wrote to each supplier.
The solution.
The count comes in through a Forms form on the phone. At 16:00 a scheduled flow compares each product with its reorder point: daily use times the supplier's delivery days plus the reserve days. What is needed to cover the next days is rounded up to whole packs and grouped by supplier in an Outlook draft, which only goes out once the owner has seen it. She gets a summary in Teams, with a highlighted warning when a product will not last until the delivery, and each draft is logged in the orders sheet.
What the client gets.
Checking and sending the ready drafts takes about 3 minutes a day, instead of doing the sums and writing to each supplier. The count is still done by a person.
Tools.
Microsoft Forms, Excel, Power Automate, Outlook and Teams, with Microsoft 365 Business Basic or higher. A wrong count makes a wrong order, and average use does not see Christmas or a big order: at those times it is adjusted by hand.
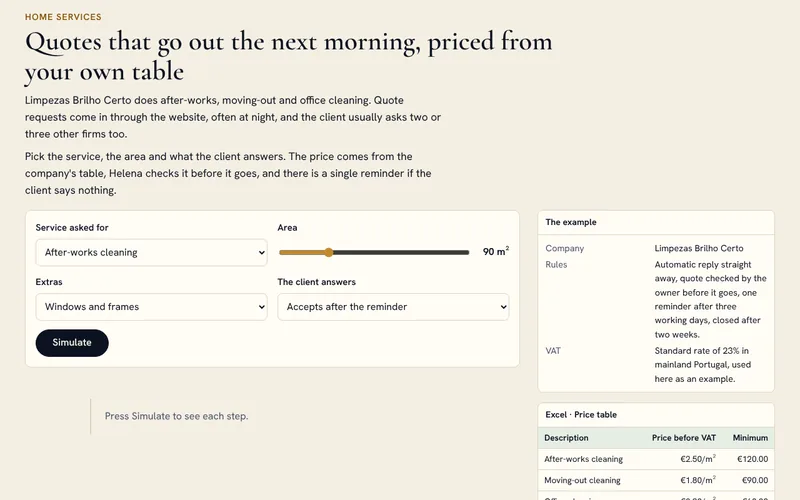
At Limpezas Brilho Certo, quote requests come in through the website, often at night, and the client usually asks two or three other companies too. Each quote done by hand took about 25 minutes.
The solution.
Each answer to the Forms form on the website starts a flow that sends the client a confirmation at once, works out the price from the Excel price table (price per square metre, minimum charge and extras) and lays out the quote in an HTML template, turned into a PDF by OneDrive. Helena gets the approval request in Teams, and only then does the e-mail go out, with buttons to accept or ask a question. After three working days without a reply one reminder goes out, the only one, and after two weeks the quote is closed as No reply. If the client accepts or asks something, the flow stops and hands the conversation to Helena.
What the client gets.
What is left is checking the draft, about 4 minutes per request, and the client knows straight away when the quote will arrive.
Tools.
Microsoft Forms, Excel, Power Automate, OneDrive, Outlook and Teams, with Microsoft 365 Business Basic or higher. It suits work that can be priced from a table: a job that needs a site visit still needs the visit.
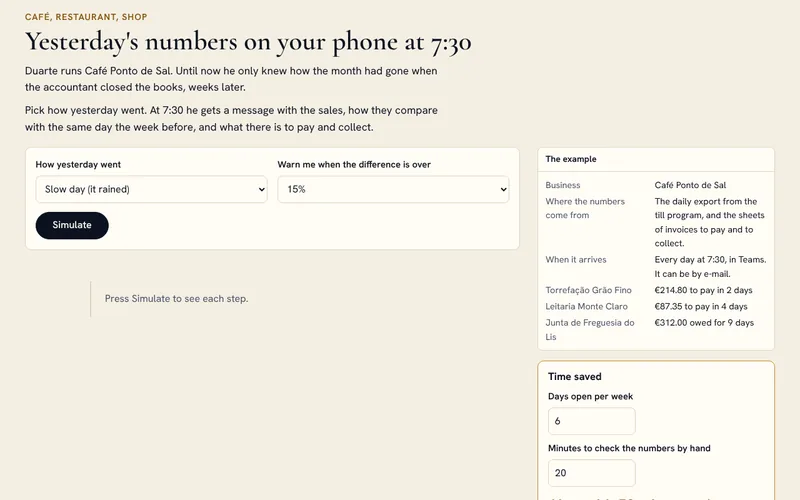
Duarte, at Café Ponto de Sal, only knew how the month had gone when the accountant closed the books, weeks later.
The solution.
At closing time, the invoicing program leaves the day's export in a OneDrive folder. At 7:30 a scheduled flow reads the file, adds the day to the sales table in Excel and compares it with the same weekday a week before: sales, receipts, average receipt and best sellers. It adds the supplier invoices due in the next seven days and the overdue client invoices, and posts the message in Teams, highlighted when the difference passes the limit that was set. If the file has not arrived, it does no sums and warns that the end-of-day close is missing.
What the client gets.
Instead of opening the invoicing program and the sheets to look for the numbers, what is left is reading one message, about 2 minutes, before opening the door.
Tools.
Excel, Power Automate, OneDrive, Teams and Outlook, with Microsoft 365 Business Basic or higher and an invoicing program that exports the day's sales. It shows sales, not profit.
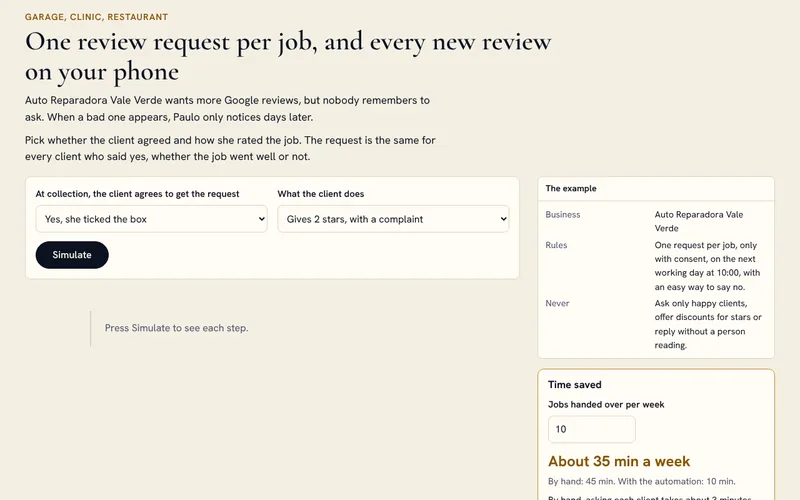
Auto Reparadora Vale Verde wants more Google reviews, but nobody remembers to ask for them. When a bad one appears, Paulo only notices days later.
The solution.
When the car is handed back, the job is closed in the app with an unticked box to accept the review request. On the next working day at 10:00, those who ticked it get a short e-mail with the link to leave a review and a way to say no: anyone who replies NO never gets another one. There is no second request. A second flow picks up the new-review notices Google sends by e-mail, logs the review in the sheet and tells Paulo in Teams, with a deadline to reply and one or two stars highlighted. He writes the replies himself.
What the client gets.
Every client who agreed gets the request without anyone having to remember, and a low review reaches the owner within minutes. The request is the same for everyone, as Google's rules require.
Tools.
Power Apps, Excel, Power Automate, Outlook and Teams, with Microsoft 365 Business Basic or higher and a Google business profile with e-mail notifications turned on. The flow reads Google's notices, not the profile: if the wording of those e-mails changes, it needs adjusting.
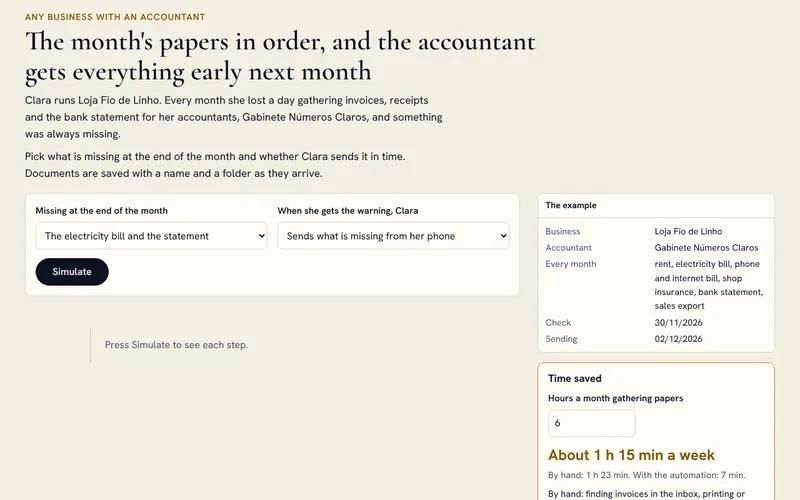
Clara, at Loja Fio de Linho, lost a day every month gathering invoices, receipts and the bank statement for Gabinete Números Claros, and something was always missing.
The solution.
Each attachment that reaches the invoices mailbox is saved in the month's folder in SharePoint, named “date, supplier, number”, and paper receipts come in as a photo through a Forms form. On the last working day, a flow checks the list of what arrives every month (rent, electricity, phone, insurance, bank statement and sales export) and says in Teams what is missing. On the second working day of the next month it checks again and sends the accountant a read-only link to the folder, with the count per folder and anything still missing. Each send is logged in a sheet.
What the client gets.
Of the hours a month spent gathering papers, about 30 minutes are left to send whatever is missing, and there is a record of what was delivered and when.
Tools.
Outlook, Power Automate, SharePoint, Microsoft Forms, Excel and Teams, with Microsoft 365 Business Basic or higher and the accountant's agreement on how things are delivered. It files and warns, but does no bookkeeping and does not check amounts.
The navigator robot in the corner of the screen. It answers questions on services, prices and timings from the site's own texts, in six languages, and turns the chat into a proposal request when it makes sense.
Live on this site
07
AI video and images
Photos and video transformed with AI. Drag the bar to compare before and after.
1 project
Video
Era after era, while you speak
A short video, shot on a phone, in which the face, the clothes and the set change era with every sentence, from the Age of Discovery to a future where there are only robots. The voice and the words belong to whoever records it.
In preparation
BeforeAfter
Real estate
The ruin, already rebuilt
A stone house in need of restoration, shown as it could look after the works. Buyers see the potential, not only the current state.
BeforeAfter
Real estate
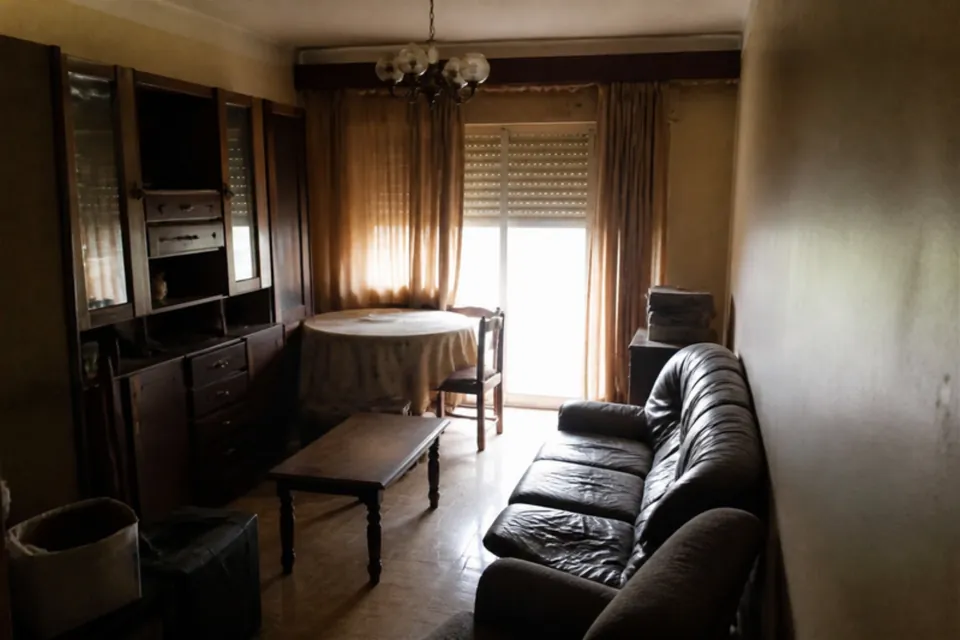
Inside, rebuilt and furnished
The ruined interior with a new ceiling, floor and window, furnished in a contemporary rustic style.
BeforeAfter
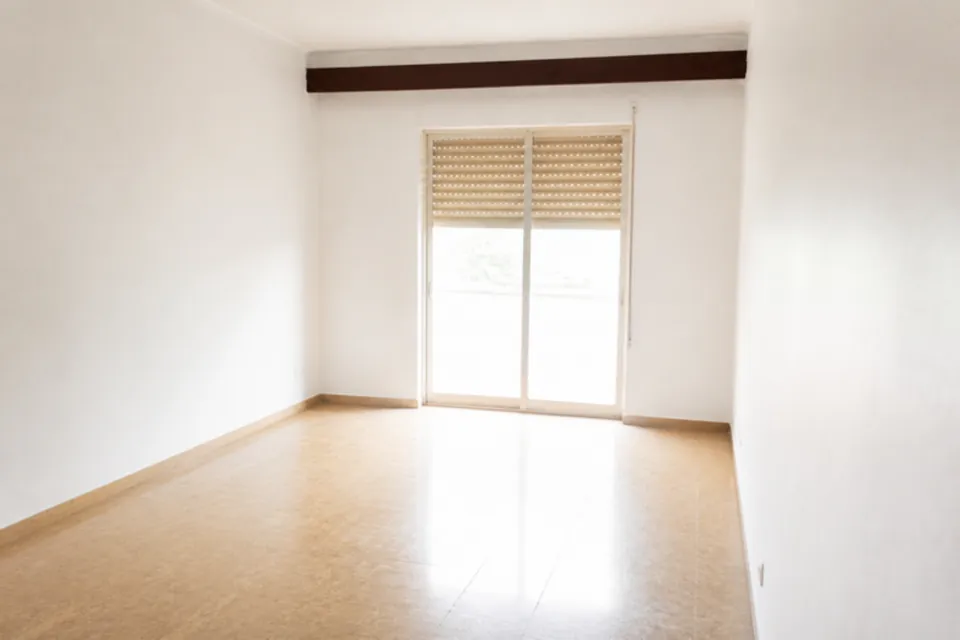
Real estate
The full room, empty and clean
The old furniture goes, the walls turn white and the room looks bigger. It becomes easier to picture your own things there.
BeforeAfter
Real estate
The empty room, now furnished
The same room, with the same light and the same walls, virtually staged for the listing.
BeforeAfter
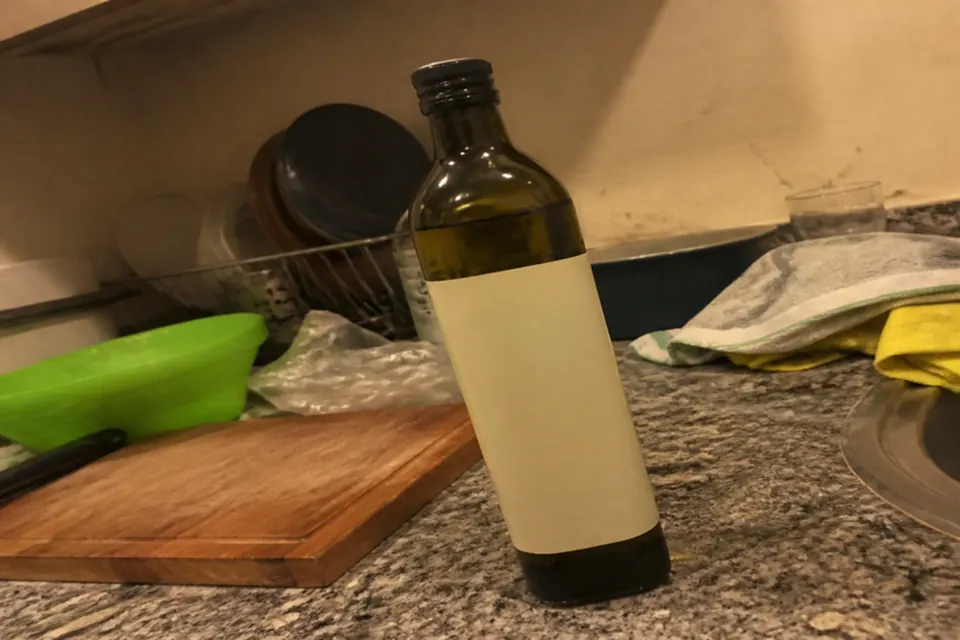
Product
From the kitchen counter to the catalogue
A bottle photographed in a hurry becomes a product photo, with studio light and a made-to-measure set.
BeforeAfter
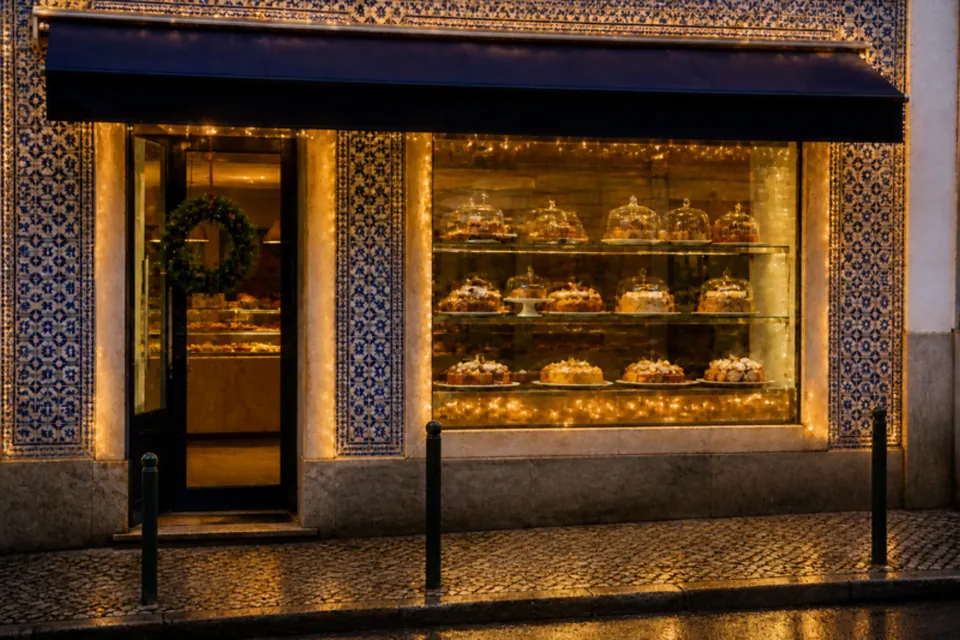
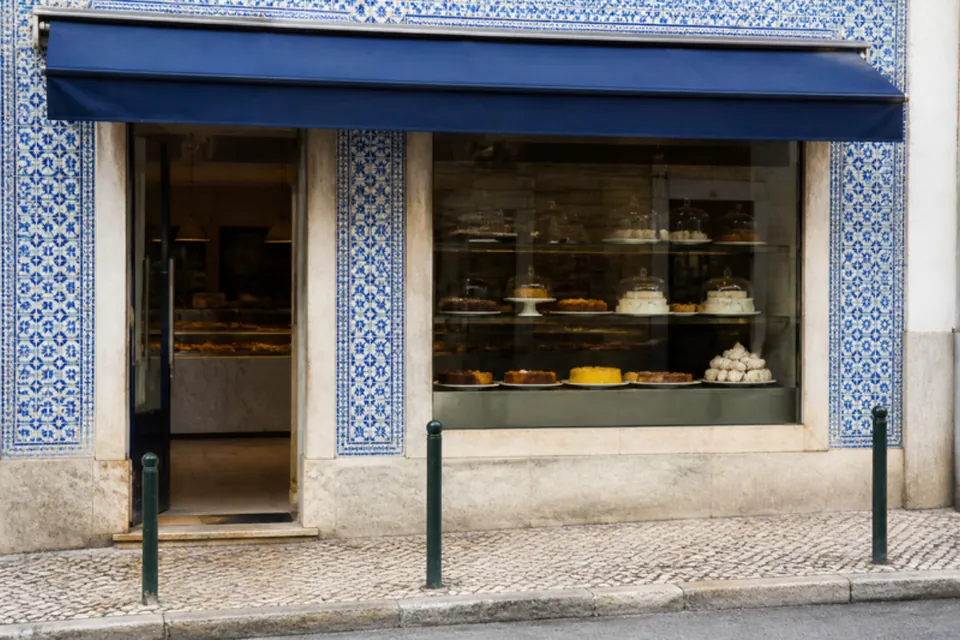
Local shop
The same shop window, at Christmas
A pastry shop front goes from an ordinary day to a December evening, with the window lit up and Christmas decorations.
08
Social media
Sample posts for high-street businesses, each one in the business's own style.
12 projects
Social media
Post kit for real estate agencies
The problem.
Every listing post comes out looking different, and the agency loses time deciding how to make it.
The solution.
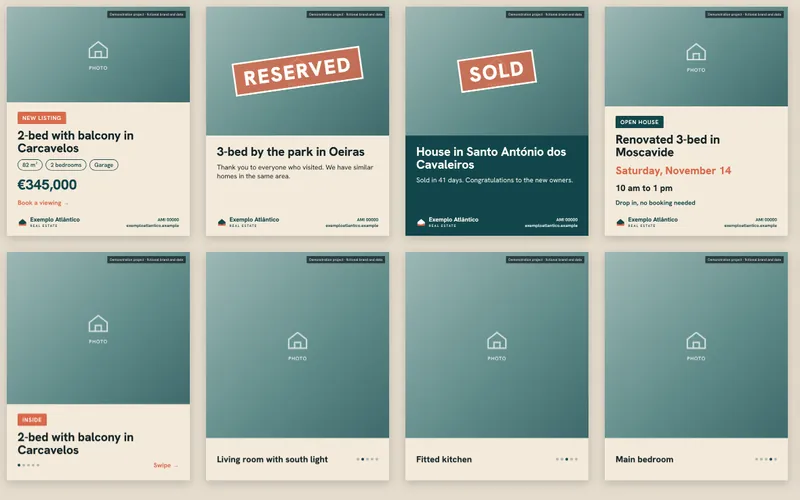
Seven ready-made templates for posts and stories, with an invented real estate brand: new listing, reserved, sold, open house, meet the consultant, tip of the month and a five-photo carousel. It comes with a one-page guide to the posting rules.
What the client gets.
A consistent look on social media and less time preparing each post.
Tools.
Custom templates built in HTML and CSS and exported as PNG images, ready to post. They can be moved to Canva if the client wants to edit them on their own.
Demonstration project with fictional data.
Fictional brand
Social media
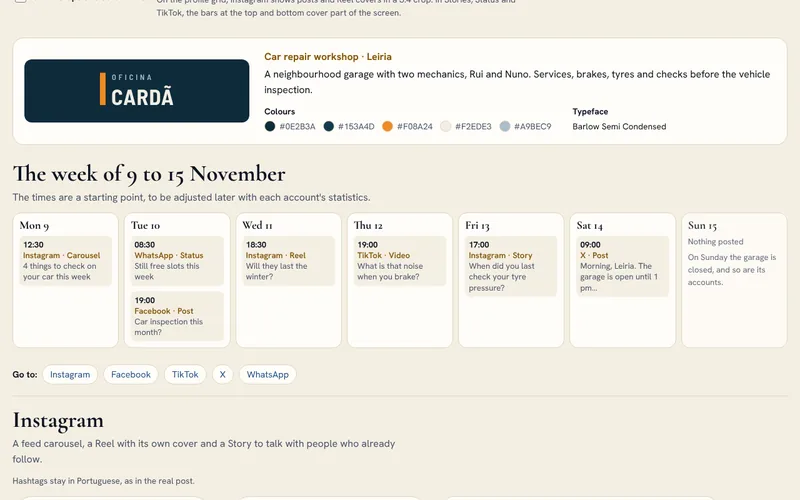
Oficina Cardã: a week of social media for a garage in Leiria
The problem.
Rui and Nuno spend the day in the workshop. They know they should post before winter and before the vehicle inspections, but not what or where, and WhatsApp, where customers already write to them, has no replies ready.
The solution.
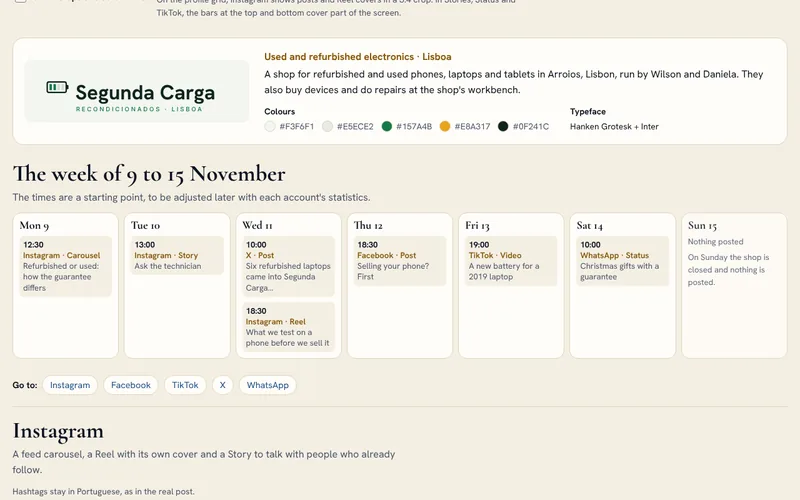
Monday, an Instagram carousel with four things to check on the car before the cold: tyres, battery, wipers and lights. Tuesday, a Facebook post for people whose inspection is this month and a WhatsApp Status with free slots on Tuesday and Thursday morning. Wednesday, a 20-second Reel on tyre tread; Thursday, a 30-second TikTok video on brake noise; Friday, a Stories poll on tyre pressure; Saturday, a notice on X that the garage is open until 1 pm. On WhatsApp Business there is the catalogue with the winter check, the greeting message that asks for the number plate and a photo of the dashboard, and quick replies for a finished car and for the address. Nothing goes out on Sunday.
What the client gets.
Once a week Rui films 20 to 30 seconds of a job, which make the Reel and, in a different cut, the TikTok video, and he photographs finished cars without showing the number plate or the customer. The texts, carousels, covers, subtitles and scheduling are on our side.
Tools.
A page in HTML, CSS and JavaScript, with no libraries. The visuals are SVG built with the brand's typeface, Barlow Semi Condensed, and download as PNG at each network's size.
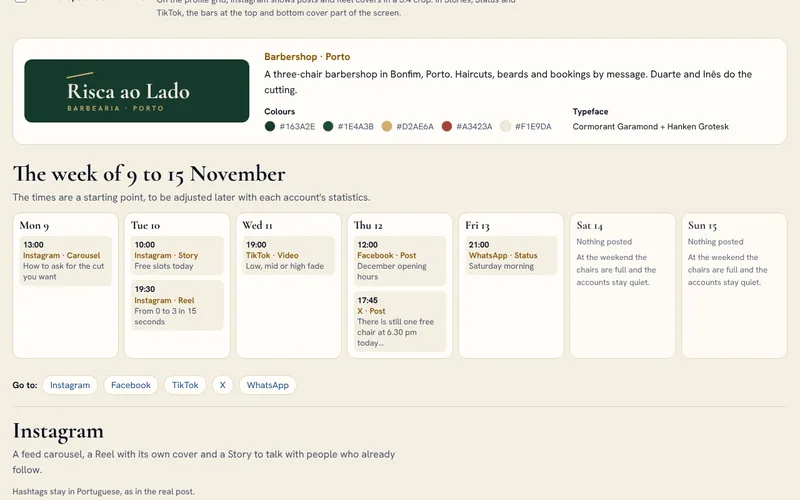
Barbearia Risca ao Lado: a week of social media for a barbershop in Porto
The problem.
At Risca ao Lado, bookings are made by message and the free slots change every day. Duarte and Inês cut hair all day, do not know what to post or where, and answer the same questions about slots and times by hand.
The solution.
Monday, an Instagram carousel on how to ask for the cut you want: bring a photo, say the clipper number, talk about the parting and the nape. Tuesday, a Story with the day's free slots and a 15-second Reel of a mid fade, from 0 to 3. Wednesday, a 25-second TikTok video on low, mid and high fades. Thursday, the December opening hours on Facebook and, on X, a free chair at 6.30 pm. Friday evening, a WhatsApp Status with the two Saturday morning slots left. On WhatsApp Business there is the catalogue with haircut and beard, the greeting message that asks for the day, the time and the service, and quick replies with the free slots and the booking reminder. The texts are informal on Instagram and TikTok and more formal on Facebook. At the weekend the accounts stay quiet.
What the client gets.
Duarte films 15 seconds of one haircut a day, always from behind or just the hands and after asking the customer, and in the evening he photographs the next day's diary for the free-slot Stories. The covers, carousels, subtitles and quick replies are on our side.
Tools.
A page in HTML, CSS and JavaScript, with no libraries. The visuals are SVG built with the brand's typefaces, Cormorant Garamond and Hanken Grotesk, and download as PNG at each network's size.
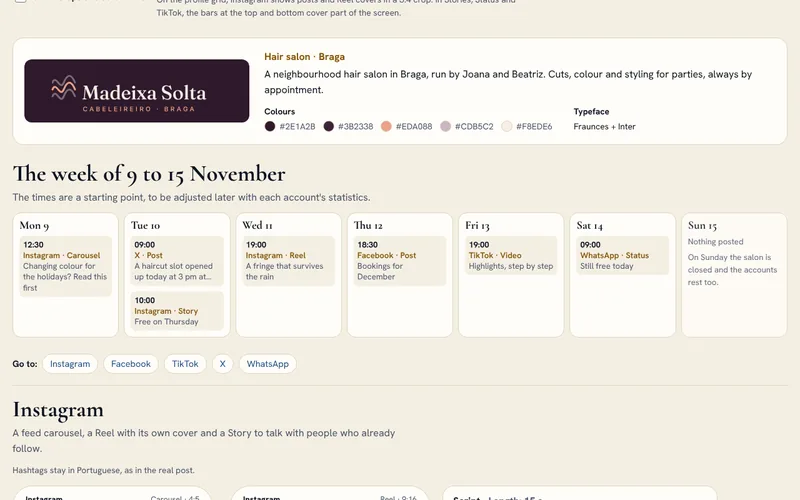
Cabeleireiro Madeixa Solta: a week of social media for a hair salon in Braga
The problem.
At Madeixa Solta everything is by appointment, and a last-minute cancellation means an empty chair. Joana and Beatriz spend the day in the salon with little time to post, and people who want to colour their hair for the holidays do not always know they need an allergy test first.
The solution.
Monday, an Instagram carousel for anyone changing colour for the holidays: the allergy test 48 hours before, a photo of the colour they want and booking early. Tuesday, a notice on X about a haircut free at 3 pm and a Story with Thursday's free slots. Wednesday, a 15-second Reel on drying a fringe so it survives the rain; Thursday, the December diary on Facebook; Friday, a 30-second TikTok video with highlights done step by step; Saturday morning, a WhatsApp Status with the day's free slots. On WhatsApp Business there is the catalogue with colour and the allergy test, the greeting message that asks for the day, the time and the service, and quick replies for the test and the opening hours. On Sunday the salon is closed, and so are its accounts.
What the client gets.
Beatriz films hands and hair, never a client's face without written permission, and when someone cancels she posts the slot in a Story using the template we left ready. The texts, the month's visuals and the video editing are on our side, and everything about colour is checked with Joana before it goes out.
Tools.
A page in HTML, CSS and JavaScript, with no libraries. The visuals are SVG built with the brand's typefaces, Fraunces and Inter, and download as PNG at each network's size.
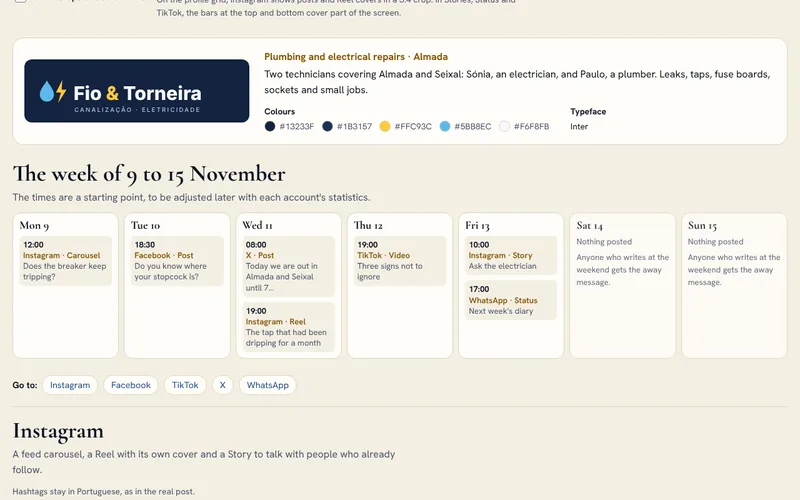
Fio & Torneira: a week of social media for an electrician and a plumber in Almada
The problem.
Sónia and Paulo spend the day in customers' homes. Almost every request comes in on WhatsApp, often out of hours, and between two jobs there is no time to think about posts.
The solution.
Monday, an Instagram carousel for when the breaker keeps tripping: unplug everything, plug in one appliance at a time, see whether it trips with nothing plugged in. Tuesday, a Facebook post on where to find the stopcock. Wednesday, a morning notice on X about water leaks and a 25-second Reel with the before and after of a tap that had been dripping. Thursday, a 30-second TikTok video with three electrical signs not to ignore. Friday, an ask-the-electrician question Story and a WhatsApp Status with the free mornings next week. On WhatsApp Business there is the catalogue with the diagnostic visit, the away message that, out of hours, says to turn off the stopcock and send a photo, and quick replies that ask for photos or offer a visit. At the weekend the away message answers.
What the client gets.
The away message and the quick replies do more work than any post. Sónia and Paulo film the before and after of one job a week, without showing the home or the people and only with the customer's permission, and the safety tips are checked with them before they go out.
Tools.
A page in HTML, CSS and JavaScript, with no libraries. The visuals are SVG built with the brand's typeface, Inter, and download as PNG at each network's size.
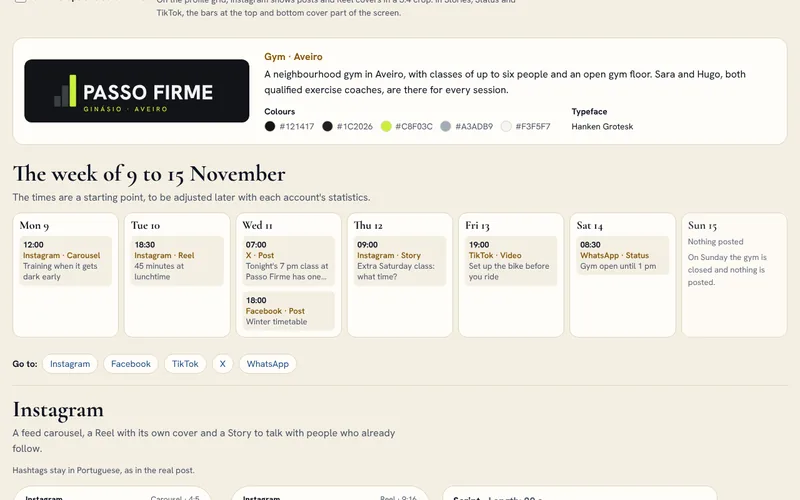
Ginásio Passo Firme: a week of social media for a gym in Aveiro
The problem.
In winter it gets dark early and some people stop training. Sara and Hugo coach every class and have no time to think about posts, and at a gym it is easy to write promises of results or health advice that have no place on social media.
The solution.
Monday, an Instagram carousel on training when it gets dark early: two fixed days in the diary, the 12.30 class and the free trial class. Tuesday, a 20-second Reel on the lunchtime class. Wednesday at 7 am, a notice on X about a place in the 7 pm class and, in the evening, the winter timetable on Facebook, with the new 7.30 am class from the 16th. Thursday, a Stories poll on the time of an extra Saturday class; Friday, a 30-second TikTok video on setting up the bike before riding; Saturday, a WhatsApp Status saying the gym is open until 1 pm. On WhatsApp Business there is the catalogue with the trial class, the away message that, out of hours, says an injury is discussed in person before the class, and quick replies for the trial class and the opening hours. On Sunday the gym is closed and nothing goes out.
What the client gets.
Sara films 10 seconds of each class, from the side or from behind, and only shows the faces of people who agreed in writing; Hugo notes down the questions he hears on the floor. We write the texts and check each one so that it promises no results and gives no health advice, build the visuals and edit the videos.
Tools.
A page in HTML, CSS and JavaScript, with no libraries. The visuals are SVG built with the brand's typeface, Hanken Grotesk, and download as PNG at each network's size.
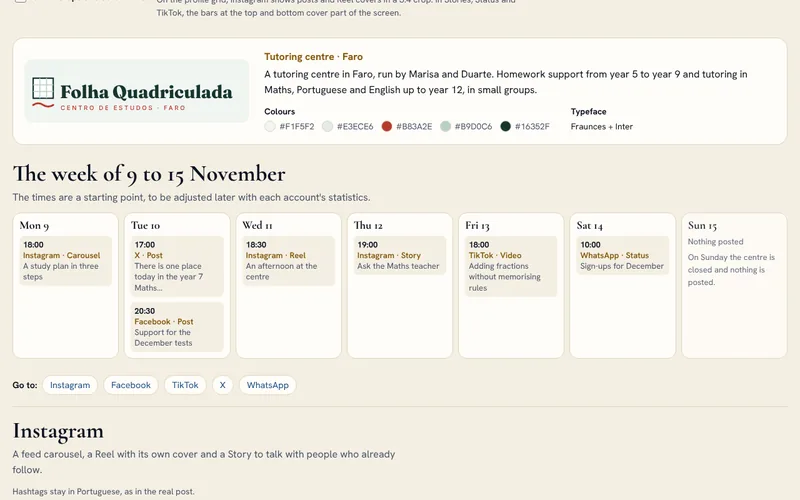
Centro de Estudos Folha Quadriculada: a week of social media for a tutoring centre in Faro
The problem.
At a tutoring centre it is the parents who decide, and many of them are on Facebook and WhatsApp. Marisa and Duarte want to show how they work without exposing the students and without promising grades, and families' questions arrive at any hour.
The solution.
Monday, an Instagram carousel with a three-step study plan for the December tests: put the dates together, split the material and do exercises. Tuesday, a notice on X about a place in the year 7 Maths group and, in the evening, the test support on Facebook, with groups of up to four students and the free assessment session. Wednesday, a 20-second Reel of an afternoon at the centre, with no faces or names; Thursday, an ask-the-Maths-teacher question Story; Friday, a 30-second TikTok video on adding fractions with the help of a drawing; Saturday, a WhatsApp Status with the places left in the Tuesday and Thursday groups. On WhatsApp Business there is the catalogue with the assessment session, the greeting message that asks when the student is free and when the next test is, and quick replies for the assessment and the opening hours. Nothing goes out on Sunday.
What the client gets.
Duarte films his hands working through exercises on the board or on paper, and no students' faces, names or notebooks ever appear. We prepare the calendar of test and exam periods, write the texts and check each one so that none promises grades, build the visuals and edit the videos.
Tools.
A page in HTML, CSS and JavaScript, with no libraries. The visuals are SVG built with the brand's typefaces, Fraunces and Inter, and download as PNG at each network's size.
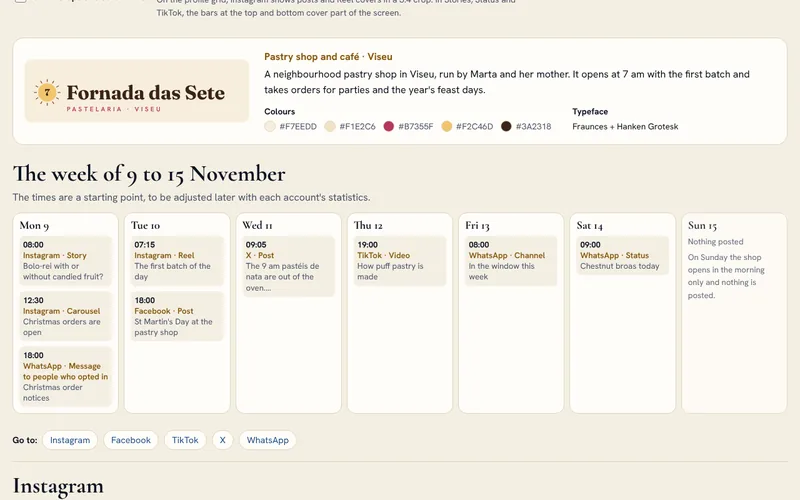
Pastelaria Fornada das Sete: a week of social media for a pastry shop in Viseu
The problem.
A neighbourhood pastry shop lives by the dates of the year, and orders come in by message and at the counter. Sending notices on WhatsApp is easy, but marketing messages to private customers need prior consent.
The solution.
Monday, Christmas orders open: an Instagram carousel with the three steps to order, a Stories poll on bolo-rei with or without candied fruit and, in the evening, a WhatsApp message sent only to the list of people who asked for the notices, with the way to opt out written in the message. Tuesday at 7.15 am, a 15-second Reel of the first batch and, in the evening, St Martin's Day on Facebook, with chestnuts roasting at the door on Wednesday. Wednesday, a notice on X when the 9 am pastéis de nata come out. Thursday, a 30-second TikTok video on how puff pastry is made. Friday, the week's post on the WhatsApp channel, and Saturday a Status with the chestnut broas. On WhatsApp Business there is also the catalogue with the 1 kg bolo-rei, the greeting message and quick replies for orders and opening hours. Nothing goes out on Sunday.
What the client gets.
Marta films 10 seconds when the oven opens and photographs the display before opening the door. At the counter she asks people who order whether they want WhatsApp notices, and we keep the list with the date each person said yes.
Tools.
A page in HTML, CSS and JavaScript, with no libraries. The visuals are SVG built with the brand's typefaces, Fraunces and Hanken Grotesk, and download as PNG at each network's size.
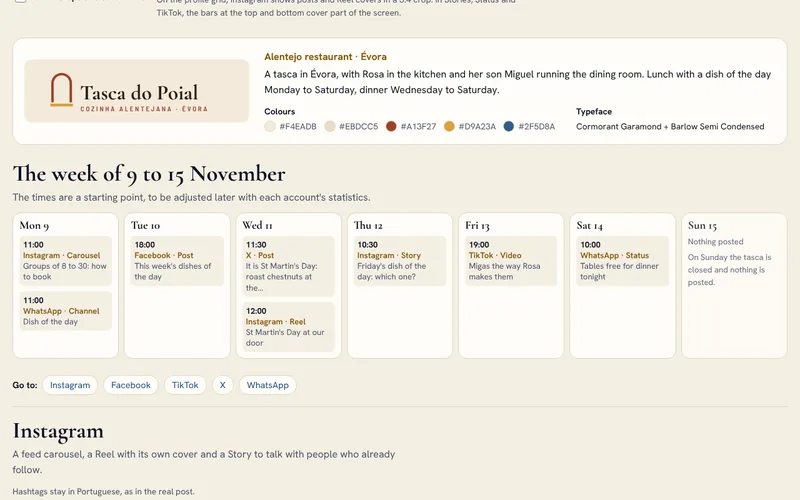
Tasca do Poial: a week of social media for a tasca in Évora
The problem.
At Tasca do Poial, Rosa runs the kitchen and her son Miguel the dining room. The dish of the day changes every morning and only appears on the slate, Christmas groups ask about the menus by message, and people with allergies want to know what they can eat.
The solution.
Monday at 11 am, an Instagram carousel on booking a Christmas dinner for 8 to 30 people, and the week's first post on the WhatsApp channel with the dish of the day, which goes out there every morning. Tuesday, the week's dishes of the day on Facebook. Wednesday is St Martin's Day: a notice on X and a 15-second Reel with chestnuts roasting at the door. Thursday, a Stories poll to choose Friday's dish, migas or dogfish soup; Friday, a 30-second TikTok video of Rosa's migas, which won the vote; Saturday, a WhatsApp Status with the two tables free for dinner. On WhatsApp Business there is also the greeting message that asks for the day, the number of people and any allergies, and quick replies for allergens and opening hours. On Sunday the tasca is closed and nothing goes out.
What the client gets.
Miguel photographs the dish of the day at the counter before 11 am and films Rosa once a week, just her hands and the pot, and what he writes on the slate is what goes on the channel. We write the week's texts, prepare the dish-of-the-day template and edit the videos, and before the group menus go out we check the allergen information with the tasca.
Tools.
A page in HTML, CSS and JavaScript, with no libraries. The visuals are SVG built with the brand's typefaces, Cormorant Garamond and Barlow Semi Condensed, and download as PNG at each network's size.
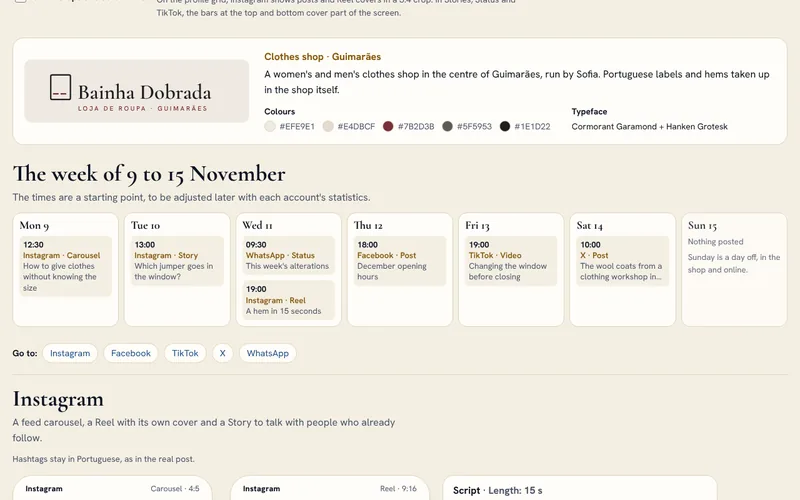
Bainha Dobrada: a week of social media for a clothes shop in Guimarães
The problem.
Sofia is alone at the counter and does the alterations in the shop. Before Christmas the same questions keep coming: what size to give, until when things can be exchanged, whether the jumper in the window is still there in a medium, and people who ask by message expect an answer the same day.
The solution.
Monday, an Instagram carousel on giving clothes without knowing the size: bring something the person wears, ask for a gift receipt and have the hem done in the shop. Tuesday, a Stories poll to choose the jumper that goes in the window. Wednesday, a WhatsApp Status saying that hems dropped off that day will be ready on Friday, and a 15-second Reel of a hem. Thursday, the December opening hours on Facebook, with the shop open on Sunday afternoons and exchanges until 10 January; Friday, a 25-second TikTok video of the new window built around the winning jumper; Saturday, a notice on X about the wool coats that arrived from a clothing workshop in Barcelos. On WhatsApp Business there is the catalogue with the hem alteration, the greeting message that asks for the item and the size, and quick replies for exchanges and opening hours. Nothing goes out on Sunday.
What the client gets.
Sofia photographs new pieces in the window in daylight and films the alterations at the machine; when someone asks about a size, she replies with a photo of the item. We plan Christmas and the January sales, write the texts, build the visuals and edit the videos, and we check the exchange rules with Sofia so that the shop and the posts say the same thing.
Tools.
A page in HTML, CSS and JavaScript, with no libraries. The visuals are SVG built with the brand's typefaces, Cormorant Garamond and Hanken Grotesk, and download as PNG at each network's size.
Nó Duplo: a week of social media for a sports shop in Coimbra
The problem.
Gonçalo has been running for fifteen years and knows what people who train need, but alone in the shop he has no time to post. In November it gets dark early, and many people do not know what to take to run safely.
The solution.
Monday, an Instagram carousel on what to take for a run after 5.30 pm: something to be seen, a head torch to see the path, gloves and an ear band. Tuesday, the Saturday group run on Facebook, about 6 km along the Mondego, free and with no sign-up. Wednesday, a notice on X about the running gloves that came in and a 15-second Reel trying a head torch in the fitting room with the lights off. Thursday, a Stories poll on running in the morning or at night; Friday, a 25-second TikTok video with the knot that gave the shop its name; Saturday at 7.30 am, a WhatsApp Status reminding people of the 9 am run. On WhatsApp Business there is the catalogue with the rechargeable head torch, the greeting message that asks for the item and the size, and quick replies for the group run and the opening hours. On Sunday the shop is closed and the accounts stay quiet.
What the client gets.
Gonçalo films products in use, in the shop or on the Saturday run, and only shows the faces of people who agree; when a delivery comes in, he photographs what is in the box. We prepare the seasonal calendar, from winter to the end-of-year races and the January return to the gym, write the texts, build the visuals and edit the videos.
Tools.
A page in HTML, CSS and JavaScript, with no libraries. The visuals are SVG built with the brand's typefaces, Barlow Semi Condensed and Inter, and download as PNG at each network's size.
Segunda Carga: a week of social media for a second-hand electronics shop in Lisbon
The problem.
Wilson and Daniela sell refurbished and used devices, buy equipment and do repairs at the shop's workbench. Customers mix up refurbished and used and ask about the guarantee, and people who want to sell their old phone do not know what to do before handing it over.
The solution.
Monday, an Instagram carousel on how refurbished and used differ: both have a 3-year guarantee, and only for a used device can it drop to 18 months, if that is agreed at purchase. Tuesday, an ask-the-technician question Story. Wednesday, a notice on X about six refurbished laptops that came in and a 20-second Reel on what is tested on a phone before it is sold. Thursday, a Facebook post with three steps before selling a phone: make a backup, sign out of the Google or Apple account and reset to factory settings. Friday, a 30-second TikTok video replacing the battery of a 2019 laptop; Saturday, a WhatsApp Status with refurbished Christmas presents. On WhatsApp Business there is the catalogue with the refurbished phone, the away message that, out of hours, asks for the make, the model and photos to value a trade-in, and quick replies for the guarantee and trade-ins. On Sunday the shop is closed and nothing goes out.
What the client gets.
Daniela photographs every device that comes in, front and back, with its label alongside, and Wilson films 10 seconds of one repair a week. We write the texts and check every mention of the guarantee against the law, Portuguese Decree-Law No. 84/2021, prepare the template for labels and new-arrival posts and edit the videos.
Tools.
A page in HTML, CSS and JavaScript, with no libraries. The visuals are SVG built with the brand's typefaces, Hanken Grotesk and Inter, and download as PNG at each network's size.